
- LIVE QUOTES
- LEARN
- HELP
 Nasdaq
 Wall Street Journal
EN
Assessing Blue Bird’s Valuation After a 435% Three Year Share Price Surge
- If you are wondering whether Blue Bird's rally has already played out or if there is still value on the table at around $51.84 a share, you are not alone. That is exactly what we are going to unpack.
- The stock has been a bit choppy lately, down 5.5% over the past month. It is still up 34.1% year to date and 435.5% over 3 years, which naturally raises questions about how much potential upside is left versus the risk you are taking on now.
- Those moves have come alongside growing investor focus on Blue Bird's role in the shift toward cleaner, more efficient school transportation, including expanding demand for electric and lower emission buses. At the same time, the broader market has been re-rating industrial and capital goods names that can show durable growth rather than just one-off post-pandemic rebounds.
- Despite that strong run, our checks suggest Blue Bird scores a 6/6 valuation score, which means it screens as undervalued on every one of our standard tests. Next up, we will break down the different valuation approaches behind that number, then circle back to a broader way to think about what this stock might be worth in the context of your portfolio.
Approach 1: Blue Bird Discounted Cash Flow (DCF) Analysis
A Discounted Cash Flow model estimates what a company is worth by projecting its future cash flows and then discounting them back to today to reflect risk and the time value of money.
For Blue Bird, the model starts with last twelve month Free Cash Flow of about $158.8 million and a 2 Stage Free Cash Flow to Equity approach. Analysts provide explicit forecasts for the next few years, and Simply Wall St then extrapolates beyond that, with Free Cash Flow projected to reach around $171.8 million by 2030 and continue growing through 2035. All of these cash flows are modelled in $ and discounted back to arrive at an intrinsic value per share.
On this basis, the DCF fair value is estimated at roughly $94.70 a share. This implies the stock is about 45.3% undervalued relative to the recent price around $51.84. In other words, the cash flow math indicates substantial upside from the current level.
Result: UNDERVALUED
Our Discounted Cash Flow (DCF) analysis suggests Blue Bird is undervalued by 45.3%. Track this in your watchlist or portfolio, or discover 901 more undervalued stocks based on cash flows.

Approach 2: Blue Bird Price vs Earnings
For profitable businesses like Blue Bird, the Price to Earnings (PE) ratio is a practical way to judge value because it links what you pay directly to the profits the company is generating today. A higher PE can sometimes be associated with expectations of faster or more reliable growth, while slower or riskier earnings usually trade on a lower, more cautious multiple.
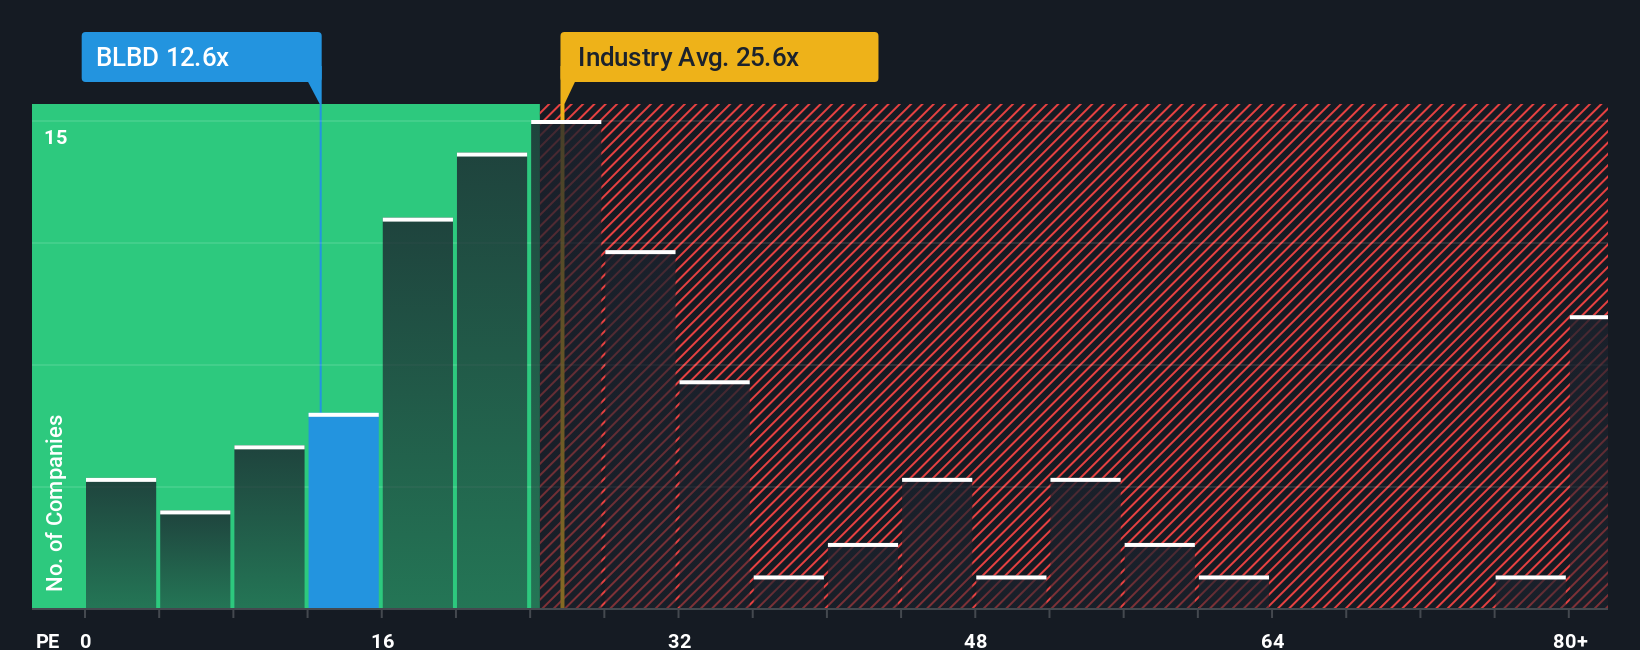
Blue Bird currently trades on a PE of about 12.9x. That is well below both the broader Machinery industry average of roughly 25.5x and the peer group average of around 17.9x, suggesting the market is still applying a discount despite the strong recent share price performance. To move beyond simple comparisons, Simply Wall St uses a proprietary Fair Ratio, which estimates what PE a company might trade on given its earnings growth outlook, industry, profit margins, market value and risk profile.
This Fair Ratio for Blue Bird is around 18.9x. This stock specific yardstick can be more informative than generic peer or sector averages because it adjusts for Blue Bird's own fundamentals rather than assuming it should resemble every other Machinery company. Comparing the Fair Ratio of 18.9x with the current PE of 12.9x suggests the shares may still be undervalued on an earnings basis.
Result: UNDERVALUED
PE ratios tell one story, but what if the real opportunity lies elsewhere? Discover 1459 companies where insiders are betting big on explosive growth.
Upgrade Your Decision Making: Choose your Blue Bird Narrative
Earlier we mentioned that there is an even better way to understand valuation, so let's introduce you to Narratives, a simple way for you to write the story behind your numbers by linking your view of Blue Bird's future revenue, earnings and margins to a financial forecast, a fair value and a clear buy or sell signal on the Simply Wall St Community page, where millions of investors share their perspectives. Narratives turn the usual one size fits all models into something personal and dynamic, helping you compare your Fair Value to the current price so you can decide whether Blue Bird looks attractive, fully valued or stretched based on your own assumptions. Because Narratives update automatically when new information arrives, like earnings surprises, fresh guidance or policy news on clean school buses, your view of the stock stays current without you having to rebuild spreadsheets. For example, one Blue Bird investor might build a bullish Narrative that assumes faster revenue growth and higher margins, leading to a Fair Value well above the current price. In contrast, a more cautious investor could plug in slower growth and lower margins, arriving at a Fair Value closer to the low analyst target of about $49 and deciding to wait.
Do you think there's more to the story for Blue Bird? Head over to our Community to see what others are saying!
This article by Simply Wall St is general in nature. We provide commentary based on historical data and analyst forecasts only using an unbiased methodology and our articles are not intended to be financial advice. It does not constitute a recommendation to buy or sell any stock, and does not take account of your objectives, or your financial situation. We aim to bring you long-term focused analysis driven by fundamental data. Note that our analysis may not factor in the latest price-sensitive company announcements or qualitative material. Simply Wall St has no position in any stocks mentioned.
Have feedback on this article? Concerned about the content? Get in touch with us directly. Alternatively, email editorial-team@simplywallst.com