
- LIVE QUOTES
- LEARN
- HELP
 Nasdaq
 Wall Street Journal
EN
Is Mitsui’s 2025 Surge Still Supported by Fundamentals After Its Strong Multi Year Rally?
- If you have been wondering whether Mitsui's huge run makes it too late to buy or still a potential value play, you are not alone.
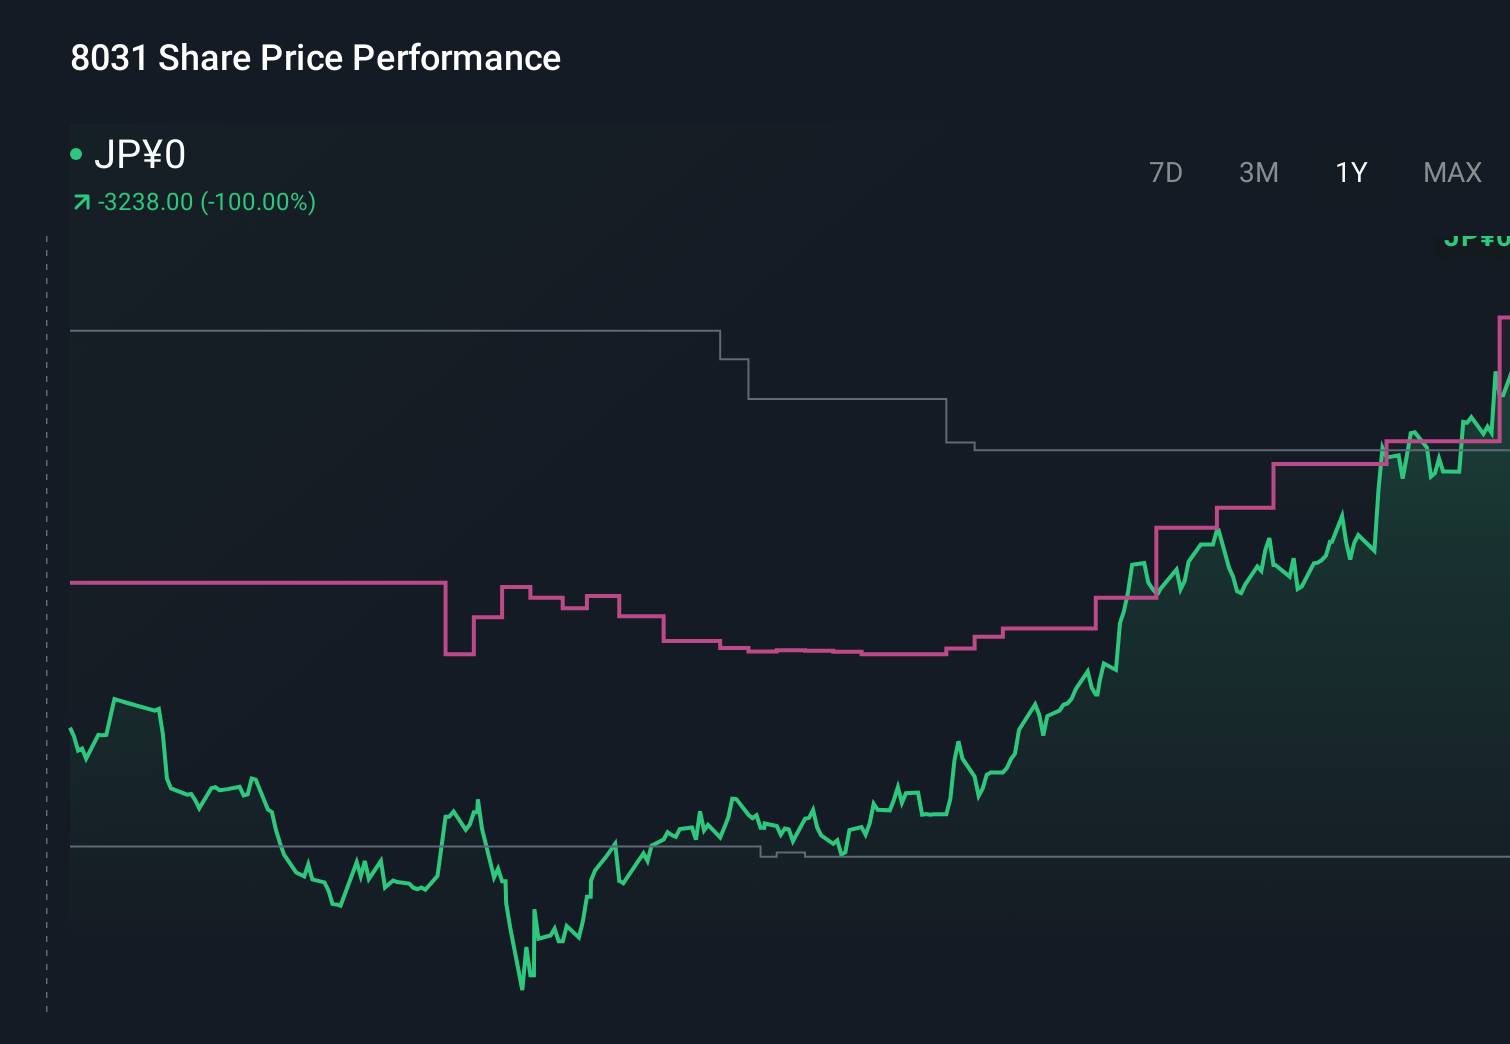
- The stock has climbed 2.2% over the last week, 14.6% in the past month, and is now up 39.0% year to date, with an impressive 44.2% 1 year, 159.3% 3 year, and 473.0% 5 year return that has definitely changed how the market sees its risk and growth profile.
- Recently, investor attention has focused on Mitsui's strategic investments in energy transition projects and expanding interests in global resource and infrastructure assets, both of which tie into long term demand themes. At the same time, commentary around Japan's corporate governance reforms and improving shareholder returns has kept trading volumes elevated as global investors reassess large trading houses like Mitsui.
- Despite that momentum, Mitsui only scores 1/6 on our undervaluation checks. In the sections that follow, we will walk through what different valuation approaches are indicating and then return at the end to a more complete way to think about what the stock may be worth.
Mitsui scores just 1/6 on our valuation checks. See what other red flags we found in the full valuation breakdown.
Approach 1: Mitsui Discounted Cash Flow (DCF) Analysis
A Discounted Cash Flow model estimates what a company is worth today by projecting the cash it can generate in the future and discounting those cash flows back to the present. For Mitsui, the model used is a 2 stage Free Cash Flow to Equity approach, based on cash flows reported and forecast in ¥.
Mitsui generated trailing twelve month free cash flow of roughly ¥533.9 Billion, and analysts see this remaining robust, with projections reaching about ¥778.0 Billion by 2030. The first five years of this path come from analyst estimates, while later years are extrapolated by Simply Wall St using modest growth assumptions to avoid overstating long term expansion.
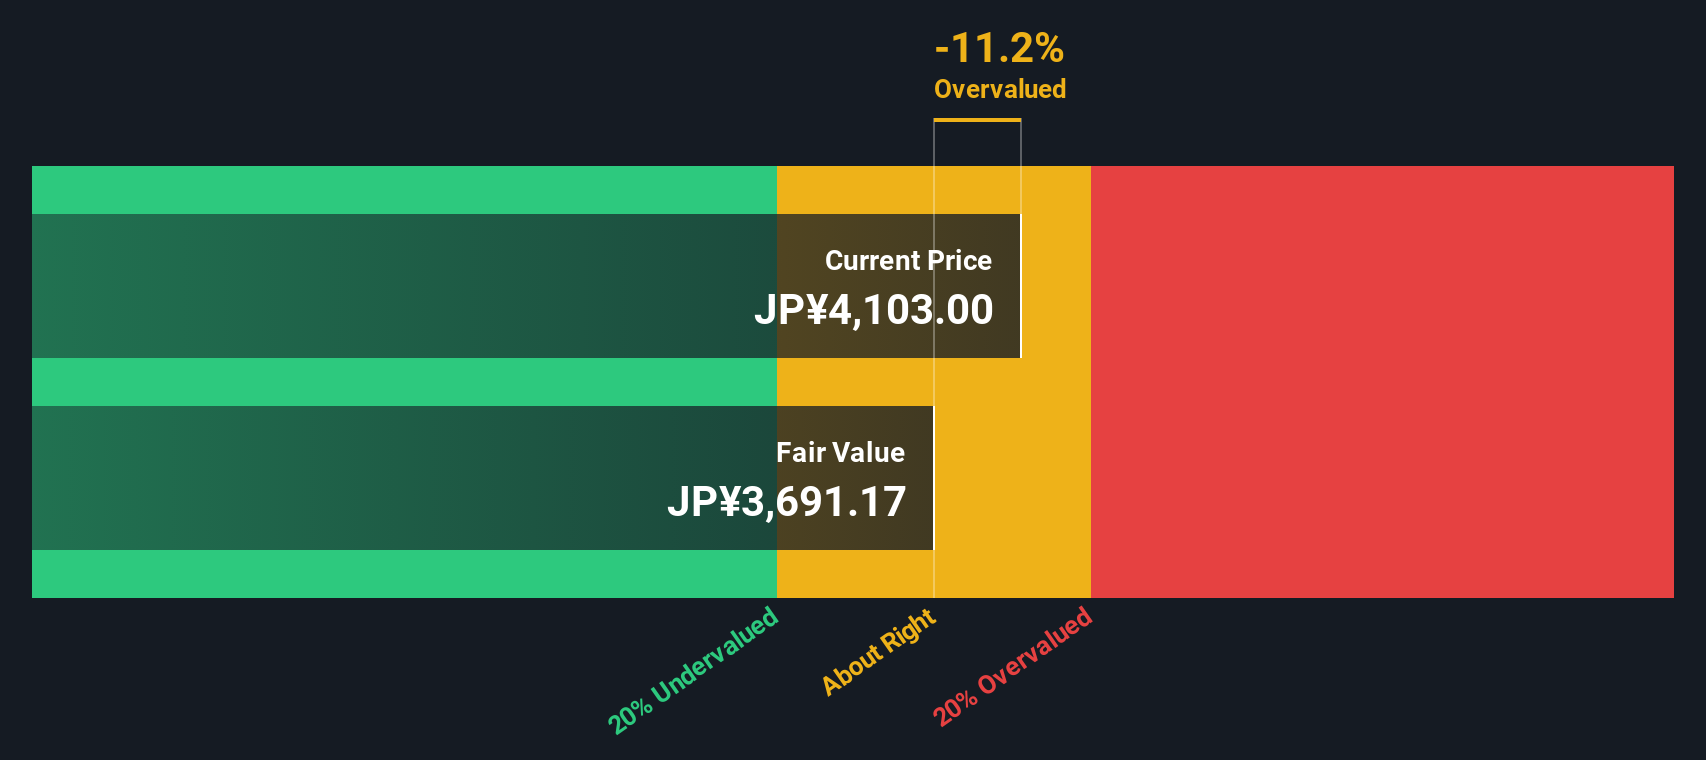
When these future cash flows are discounted back, the model arrives at an intrinsic value of about ¥4,384 per share, implying the stock is roughly 4.2% above its calculated fair value. That places Mitsui in a narrow band around fair value rather than in clear bargain or bubble territory.
Result: ABOUT RIGHT
Mitsui is fairly valued according to our Discounted Cash Flow (DCF), but this can change at a moment's notice. Track the value in your watchlist or portfolio and be alerted on when to act.
Approach 2: Mitsui Price vs Earnings
For profitable, relatively mature businesses like Mitsui, the price to earnings ratio is a useful yardstick because it directly links what investors are paying for each unit of current earnings. It is also intuitive, which makes it a common anchor for how the market judges value.
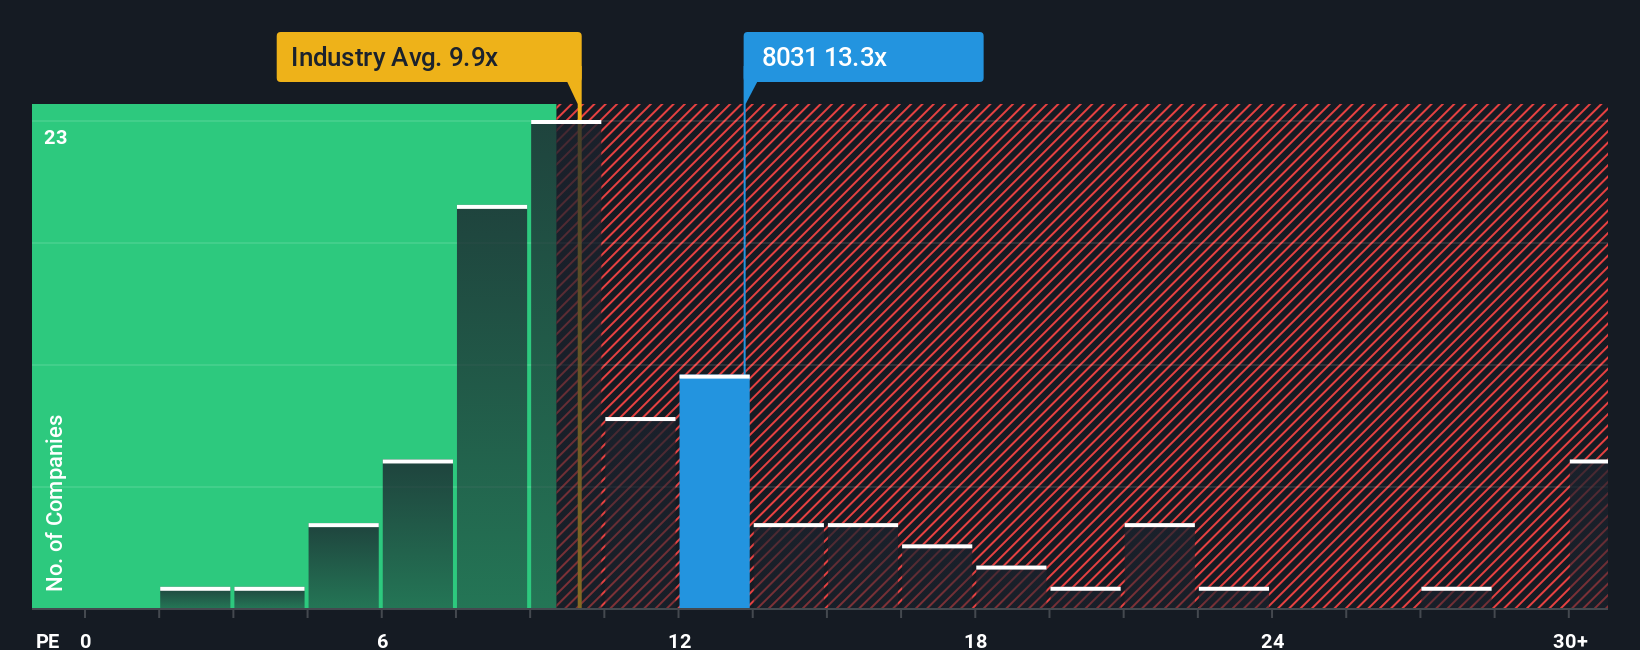
In practice, a higher or lower PE ratio reflects expectations for future growth and the perceived risk around those earnings. Faster, more reliable growth and lower risk usually justify a higher multiple, while cyclical or uncertain earnings tend to keep PE ratios subdued. Mitsui currently trades on about 14.36x earnings, slightly above its peer average of 14.13x and meaningfully above the broader Trade Distributors industry, which sits around 10.29x.
Simply Wall St also uses a proprietary Fair Ratio, which estimates what Mitsui’s PE should be after adjusting for its earnings growth outlook, profitability, industry, size, and risk profile. This Fair Ratio stands at 22.33x, suggesting the market is assigning a discount relative to what those fundamentals might justify. Because the Fair Ratio is tailored to Mitsui’s specific characteristics, it is a more nuanced guide than simple peer or industry comparisons. On this basis, the current 14.36x multiple indicates that the shares may be undervalued rather than fully priced.
Result: UNDERVALUED
PE ratios tell one story, but what if the real opportunity lies elsewhere? Discover 1460 companies where insiders are betting big on explosive growth.
Upgrade Your Decision Making: Choose your Mitsui Narrative
Earlier we mentioned that there is an even better way to understand valuation, so let us introduce Narratives, a simple way to connect your view of Mitsui’s future with a concrete forecast and a fair value estimate you can actually act on.
A Narrative is your story behind the numbers, where you spell out how you expect Mitsui’s revenue, earnings, and margins to evolve, and let the platform turn that story into a financial model and a fair value per share.
On Simply Wall St’s Community page, used by millions of investors, Narratives make this process quick and accessible by guiding you from your assumptions, to a forecast, to a Fair Value that you can compare with today’s share price to decide whether Mitsui looks like a buy, hold, or sell.
Because Narratives update dynamically when fresh news or earnings arrive, your fair value view can evolve with the company instead of staying frozen in last quarter’s data. You can also see how different investors frame Mitsui, from those who assume higher long term revenue growth, margins and a fair value near ¥4,487, to more cautious views that build in slower growth, lower profitability and a much lower fair value.
Do you think there's more to the story for Mitsui? Head over to our Community to see what others are saying!
This article by Simply Wall St is general in nature. We provide commentary based on historical data and analyst forecasts only using an unbiased methodology and our articles are not intended to be financial advice. It does not constitute a recommendation to buy or sell any stock, and does not take account of your objectives, or your financial situation. We aim to bring you long-term focused analysis driven by fundamental data. Note that our analysis may not factor in the latest price-sensitive company announcements or qualitative material. Simply Wall St has no position in any stocks mentioned.
Have feedback on this article? Concerned about the content? Get in touch with us directly. Alternatively, email editorial-team@simplywallst.com