
- LIVE QUOTES
- LEARN
- HELP
 Nasdaq
 Wall Street Journal
EN
Is PepsiCo’s Recent Share Price Slide Creating a Quiet Opportunity in 2025?
- Wondering if PepsiCo at around $143 is a quietly attractive entry point, or just an expensive comfort stock you already know too well?
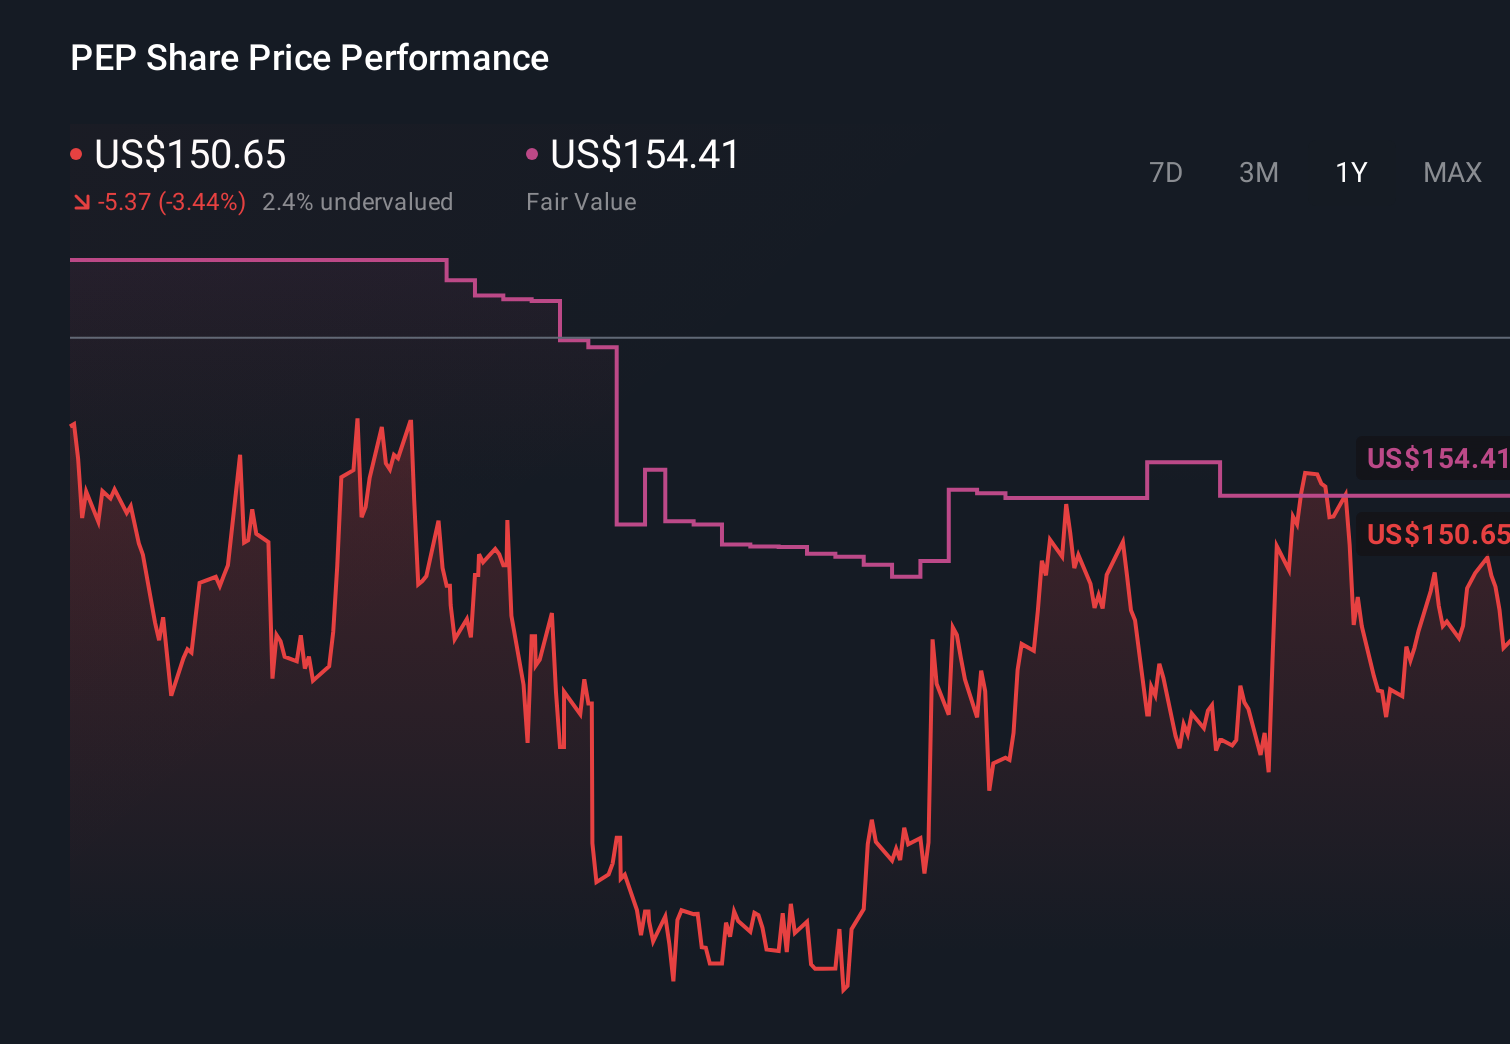
- The share price has drifted lower recently, with returns of -4.2% over the last week, -1.2% over the last month, and -4.3% year to date, even though the 5 year return still sits at a modest 13.8%.
- Recent headlines have focused on PepsiCo doubling down on its snacks and beverages portfolio, from expanding zero sugar offerings to rolling out new product innovations in international markets. At the same time, investors have been weighing macro worries like consumer spending pressures and higher interest rates, which can change how defensives like PepsiCo are valued.
- On our valuation checks, PepsiCo scores a 2/6, suggesting it looks undervalued on only some metrics. Next, we will break down what different valuation approaches are saying and, by the end of the article, look at a more complete way to think about what the stock is really worth.
PepsiCo scores just 2/6 on our valuation checks. See what other red flags we found in the full valuation breakdown.
Approach 1: PepsiCo Discounted Cash Flow (DCF) Analysis
A Discounted Cash Flow model estimates what a business is worth today by projecting the cash it can generate in the future and discounting those cash flows back to the present.
For PepsiCo, the model starts with last twelve month Free Cash Flow of about $6.4 Billion, then uses analyst forecasts and extrapolations by Simply Wall St to project steady growth. On this basis, PepsiCo is expected to generate roughly $13.7 Billion in Free Cash Flow by 2029, with further gradual increases over the following years as the business expands.
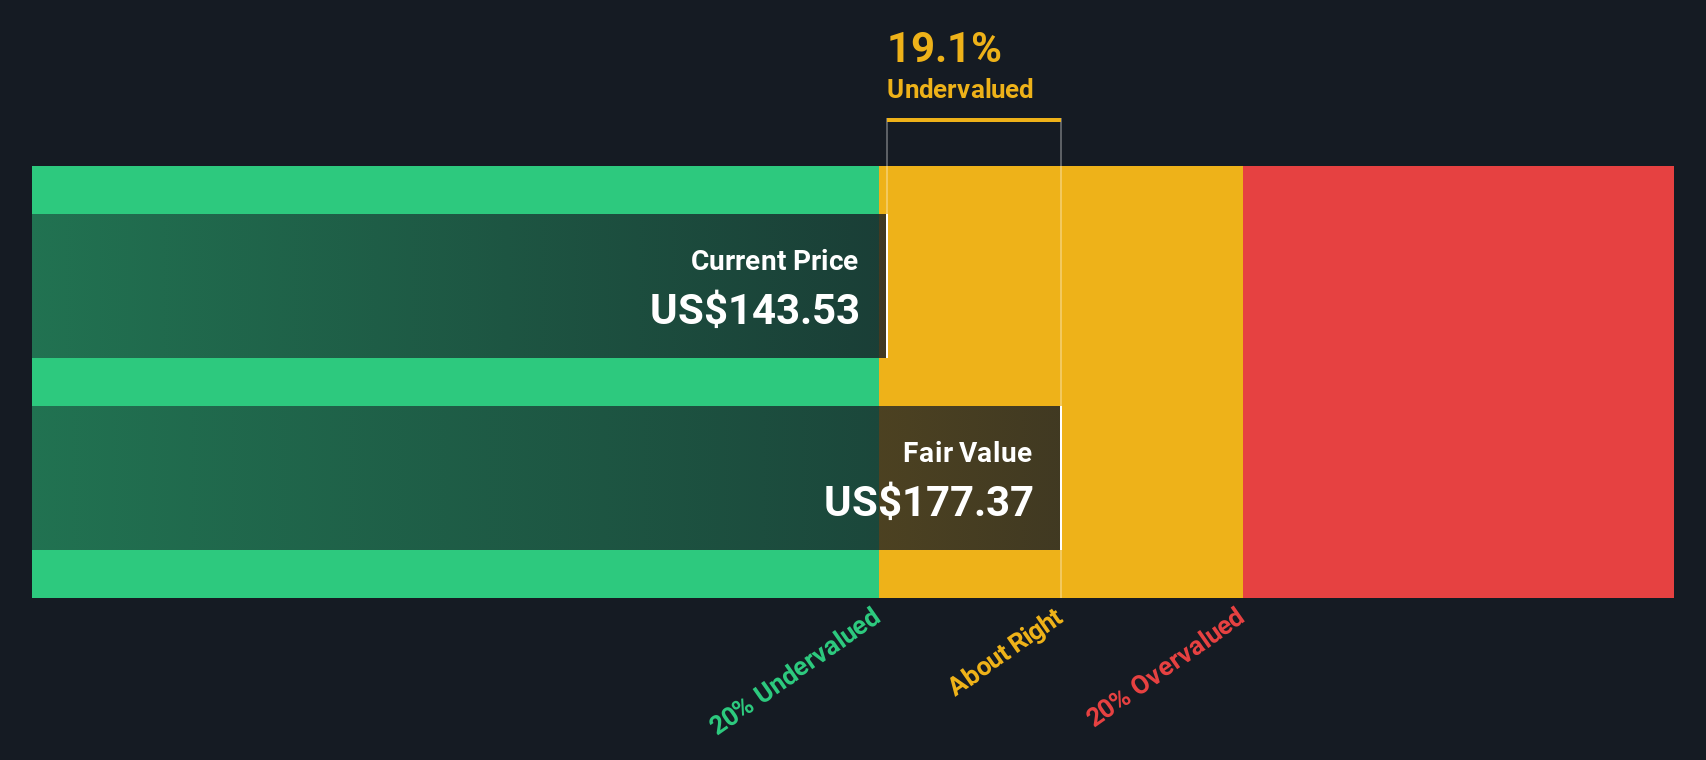
When all those projected cash flows are discounted back to today in a 2 Stage Free Cash Flow to Equity model, Simply Wall St estimates an intrinsic value of about $246.93 per share. Compared with the current share price around $143, the DCF implies the stock is about 41.8% undervalued, indicating that the market price is below the estimated long term cash generation potential.
Result: UNDERVALUED
Our Discounted Cash Flow (DCF) analysis suggests PepsiCo is undervalued by 41.8%. Track this in your watchlist or portfolio, or discover 903 more undervalued stocks based on cash flows.
Approach 2: PepsiCo Price vs Earnings
For a mature and consistently profitable business like PepsiCo, the Price to Earnings, or PE, ratio is a practical way to gauge what investors are willing to pay for each dollar of current earnings. It captures the market view on both the quality and durability of those earnings.
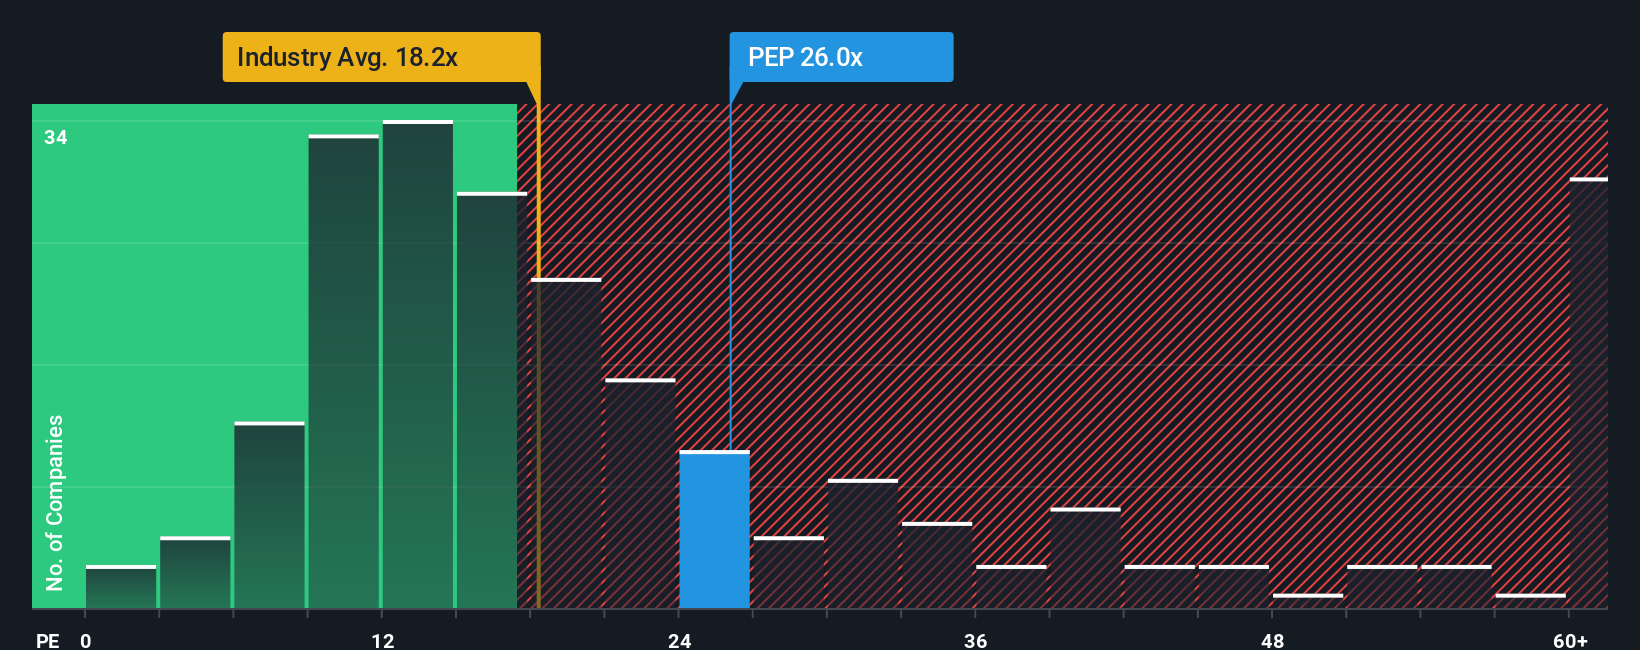
In general, companies with stronger growth prospects and lower perceived risk tend to have a higher PE, while slower growing or riskier firms usually trade on a lower multiple. PepsiCo currently trades on a PE of about 27.5x, which is above the broader Beverage industry average of roughly 17.5x and slightly higher than its peer group average near 26.6x.
Simply Wall St also calculates a Fair Ratio of 26.8x, a proprietary estimate of what PepsiCo’s PE could be given its earnings growth outlook, margins, industry, size and risk profile. This can be more informative than a simple comparison to peers or the sector, because it explicitly adjusts for company specific strengths and weaknesses rather than assuming all beverage stocks should trade on the same multiple. With PepsiCo’s actual PE only modestly above the Fair Ratio, the shares appear broadly in line with what its fundamentals suggest at today’s prices.
Result: ABOUT RIGHT
PE ratios tell one story, but what if the real opportunity lies elsewhere? Discover 1460 companies where insiders are betting big on explosive growth.
Upgrade Your Decision Making: Choose your PepsiCo Narrative
Earlier we mentioned that there is an even better way to understand valuation, so let us introduce you to Narratives, a simple way to connect your view of PepsiCo’s story with a concrete forecast for its future revenue, earnings and margins, and then translate that into a Fair Value you can compare to today’s price. On Simply Wall St’s Community page, Narratives are easy to use and are already helping millions of investors turn their qualitative opinions into quantitative scenarios that clearly show whether a stock looks like a buy, hold or sell when Fair Value is lined up against the current share price. Each Narrative is dynamic, automatically updating when new information, like earnings results or major news, changes the outlook so your valuation does not go stale. For PepsiCo, one investor might focus on international expansion, productivity gains and healthier products and arrive at a Fair Value closer to $175. Another investor, more cautious about legacy categories, input costs and regulation, could see fair value nearer $115. Narratives make those differing views transparent, structured and directly comparable.
Do you think there's more to the story for PepsiCo? Head over to our Community to see what others are saying!
This article by Simply Wall St is general in nature. We provide commentary based on historical data and analyst forecasts only using an unbiased methodology and our articles are not intended to be financial advice. It does not constitute a recommendation to buy or sell any stock, and does not take account of your objectives, or your financial situation. We aim to bring you long-term focused analysis driven by fundamental data. Note that our analysis may not factor in the latest price-sensitive company announcements or qualitative material. Simply Wall St has no position in any stocks mentioned.
Have feedback on this article? Concerned about the content? Get in touch with us directly. Alternatively, email editorial-team@simplywallst.com