
- LIVE QUOTES
- LEARN
- HELP
 Nasdaq
 Wall Street Journal
EN
Is ICE Stock Pricing In Too Much Optimism After Its Recent Share Price Gains?
- Wondering if Intercontinental Exchange is still a smart buy at around $162 a share, or if most of the upside has already been priced in? Let us unpack what the market might be implying about its long term value.
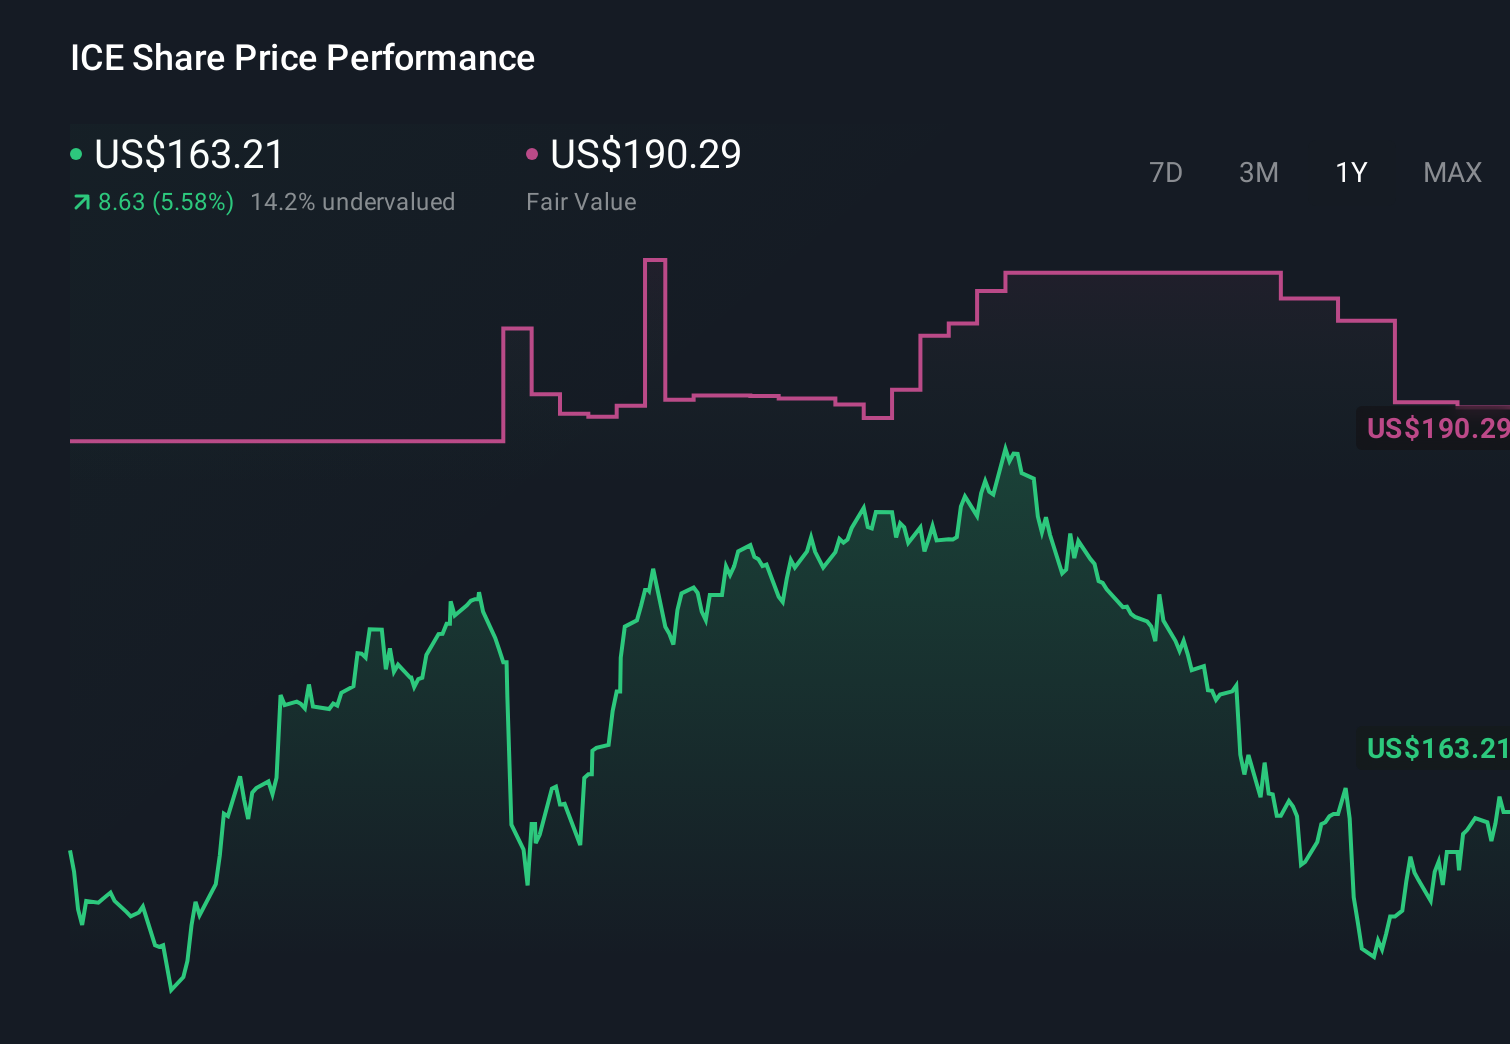
- The stock has climbed 1.1% over the last week, 6.4% over the past month, and is up 9.3% over the past year, adding to strong 3 year and 5 year gains of 65.3% and 53.2% respectively.
- Those moves sit against a backdrop of ICE steadily expanding its exchanges and data businesses, while integrating recent acquisitions to deepen its footprint across fixed income and mortgage markets. Investors have been responding to this push into more recurring revenue and critical market infrastructure, which can change how the market thinks about the company’s long term growth profile and risk.
- Despite that strength, our valuation framework shows Intercontinental Exchange scoring just 1 out of 6 on our undervaluation checks. We will walk through what different valuation methods say about the stock, and then finish with a more holistic way to think about its true worth beyond the headline multiples.
Intercontinental Exchange scores just 1/6 on our valuation checks. See what other red flags we found in the full valuation breakdown.
Approach 1: Intercontinental Exchange Excess Returns Analysis
The Excess Returns model estimates what Intercontinental Exchange can earn above its cost of equity on each dollar of shareholder capital, then capitalizes those surplus profits into an intrinsic value per share.
For ICE, the model starts with a Book Value of $50.25 per share and a Stable EPS of $7.43 per share, based on weighted future Return on Equity estimates from 5 analysts. That implies an Average Return on Equity of 14.62%, comfortably above the assumed Cost of Equity of $4.37 per share. The difference, an Excess Return of $3.06 per share, reflects the value ICE creates beyond investors’ required return.
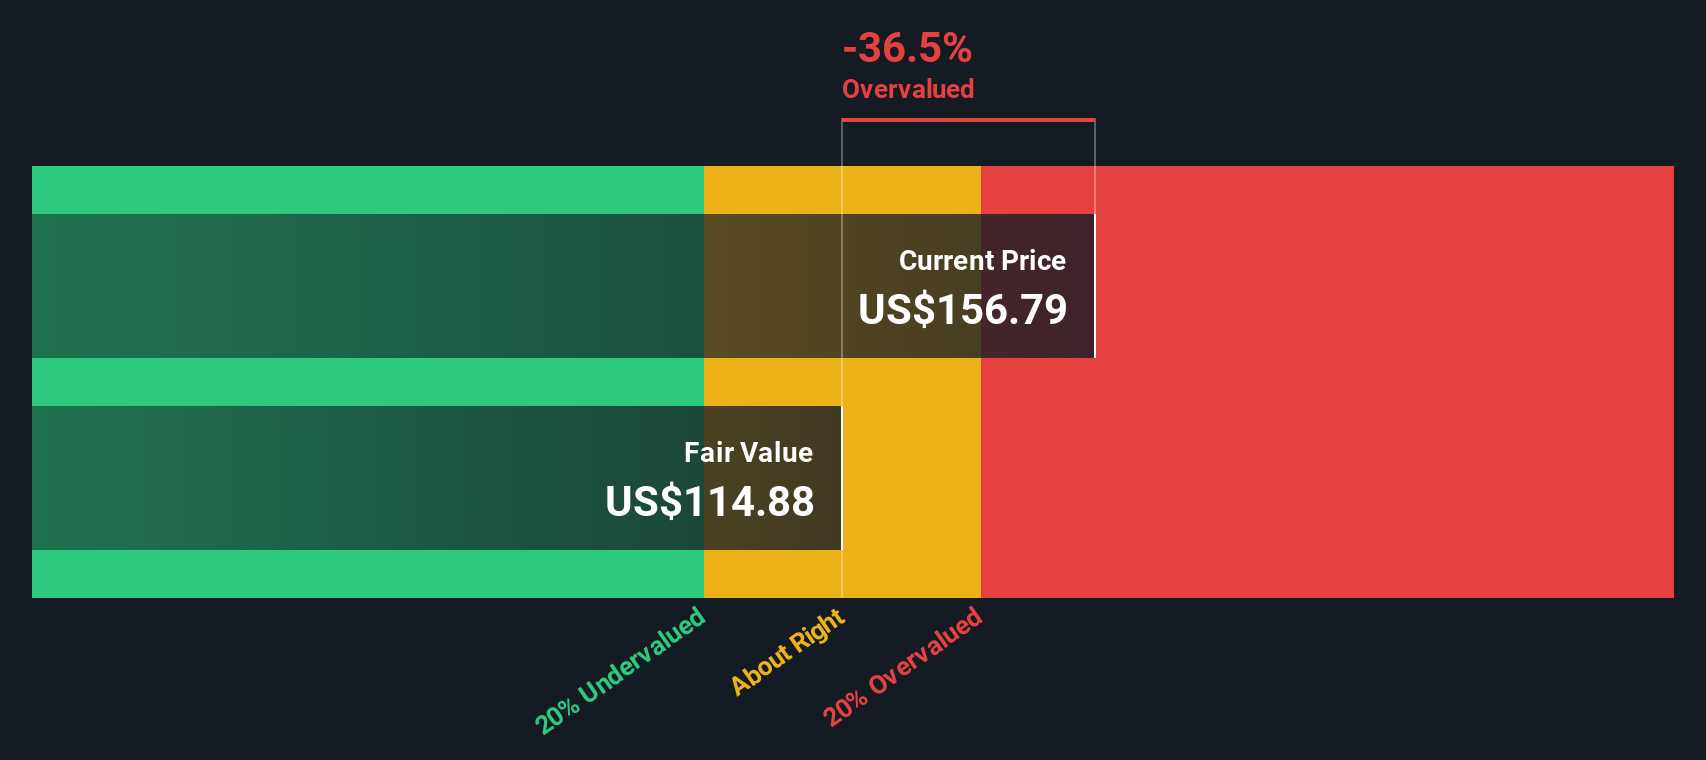
Using a Stable Book Value of $50.83 per share, sourced from 3 analysts’ estimates, these excess returns are projected forward and discounted back to arrive at an intrinsic value of about $108 per share. With the stock trading around $162, the Excess Returns model indicates ICE is roughly 50.4% overvalued, and that the market is paying a high premium for its quality and growth profile.
Result: OVERVALUED
Our Excess Returns analysis suggests Intercontinental Exchange may be overvalued by 50.4%. Discover 901 undervalued stocks or create your own screener to find better value opportunities.
Approach 2: Intercontinental Exchange Price vs Earnings
For a profitable, mature business like Intercontinental Exchange, the price to earnings ratio is a useful way to gauge how much investors are willing to pay today for each dollar of current earnings. It captures not only today’s profitability, but also the market’s expectations for how quickly those earnings will grow and how risky that growth might be.
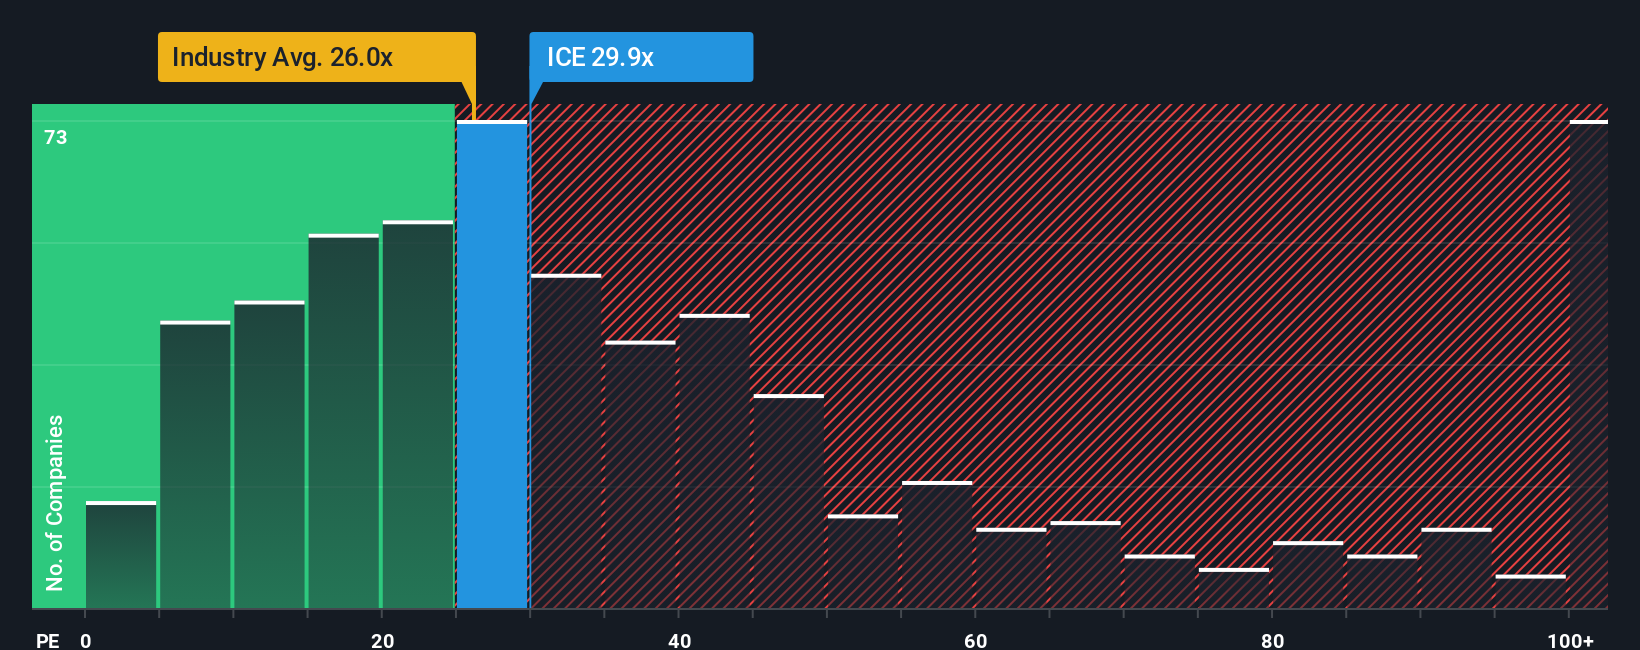
Higher growth and lower perceived risk usually justify a higher, or more generous, PE multiple, while slower or more volatile earnings typically deserve a lower one. ICE currently trades on about 29.3x earnings, which is above the broader Capital Markets industry average of roughly 25.7x, but below the peer group average of around 35.1x. That indicates the market already prices ICE as a quality name, but not at the very top tier of its sector.
Simply Wall St’s Fair Ratio, at 16.1x, goes a step further by estimating the multiple ICE should trade on given its specific mix of earnings growth, profitability, risk profile, industry, and size. Because this metric is tailored to the company, it can be more informative than broad comparisons to peers or the industry alone. With the current PE of 29.3x sitting well above the 16.1x Fair Ratio, the multiple analysis suggests ICE is trading at a premium to what its fundamentals would typically warrant.
Result: OVERVALUED
PE ratios tell one story, but what if the real opportunity lies elsewhere? Discover 1460 companies where insiders are betting big on explosive growth.
Upgrade Your Decision Making: Choose your Intercontinental Exchange Narrative
Earlier we mentioned that there is an even better way to understand valuation, so let us introduce you to Narratives, a simple idea where you write the story you believe about Intercontinental Exchange and connect it directly to your own forecast for its future revenue, earnings, margins, and ultimately fair value.
A Narrative takes your view of the business, for example how durable ICE’s data moat is or how big its mortgage platform can become, turns that into concrete financial assumptions, and then translates those assumptions into a fair value that you can compare against today’s share price to decide whether to buy, hold, or sell.
On Simply Wall St, Narratives live in the Community page and are used by millions of investors as an easy, accessible tool that automatically updates when new information like earnings releases, product launches, or regulatory news comes in, so your thesis and valuation stay in sync with reality.
For example, one ICE Narrative on the platform might assume faster growth, higher long term margins, and a fair value closer to about $227 per share. In contrast, a more cautious Narrative might bake in slower growth, more integration risk, and a fair value closer to about $170 per share, clearly showing how different stories can justify very different target prices.
Do you think there's more to the story for Intercontinental Exchange? Head over to our Community to see what others are saying!
This article by Simply Wall St is general in nature. We provide commentary based on historical data and analyst forecasts only using an unbiased methodology and our articles are not intended to be financial advice. It does not constitute a recommendation to buy or sell any stock, and does not take account of your objectives, or your financial situation. We aim to bring you long-term focused analysis driven by fundamental data. Note that our analysis may not factor in the latest price-sensitive company announcements or qualitative material. Simply Wall St has no position in any stocks mentioned.
Have feedback on this article? Concerned about the content? Get in touch with us directly. Alternatively, email editorial-team@simplywallst.com