
- LIVE QUOTES
- LEARN
- HELP
 Nasdaq
 Wall Street Journal
EN
S&P Global (SPGI): Assessing a Rich Valuation After Recent Share Price Strength
Why S&P Global Is Back on Investor Radar
S&P Global (SPGI) has quietly added roughly 7% over the past month, outpacing the broader market and nudging back toward its highs as demand for data, indices, and ratings keeps building.
See our latest analysis for S&P Global.
That recent 7.5% 1 month share price return has added to a steadier climb over the year. A robust 3 year total shareholder return of around 64% shows longer term momentum is still very much intact.
If this kind of steady compounding appeals to you, it might also be a good time to explore fast growing stocks with high insider ownership for other potentially under the radar opportunities.
With shares hovering near record highs and analysts still seeing upside, the key question now is whether S&P Global is trading at a rare discount to its long term prospects or if the market has already priced in the next leg of growth.
Price-to-Earnings of 37.8x: Is it justified?
At roughly $525.74 per share, S&P Global trades on a 37.8x price-to-earnings multiple, well above many peers and the wider market.
The price-to-earnings ratio compares a company’s share price with its earnings per share. It effectively shows how many dollars investors are willing to pay for each dollar of current profit.
For S&P Global, that 37.8x multiple suggests investors are paying a premium for a business with durable, data-driven revenue streams and double-digit earnings growth, even though earnings are only expected to grow at a moderate pace over the coming years. Relative to the estimated fair price-to-earnings ratio of 17.9x, the current valuation looks stretched and could compress if growth or profitability disappoint.
Against the US Capital Markets industry average of 25.7x and a peer average of around 33x, S&P Global’s 37.8x stands out as meaningfully higher. This signals that the market is assigning it a top-tier status that other players in the space do not yet enjoy.
Explore the SWS fair ratio for S&P Global
Result: Price-to-Earnings of 37.8x (OVERVALUED)
However, regulatory scrutiny of credit ratings and any slowdown in capital markets activity could challenge S&P Global’s premium valuation and dampen earnings momentum.
Find out about the key risks to this S&P Global narrative.
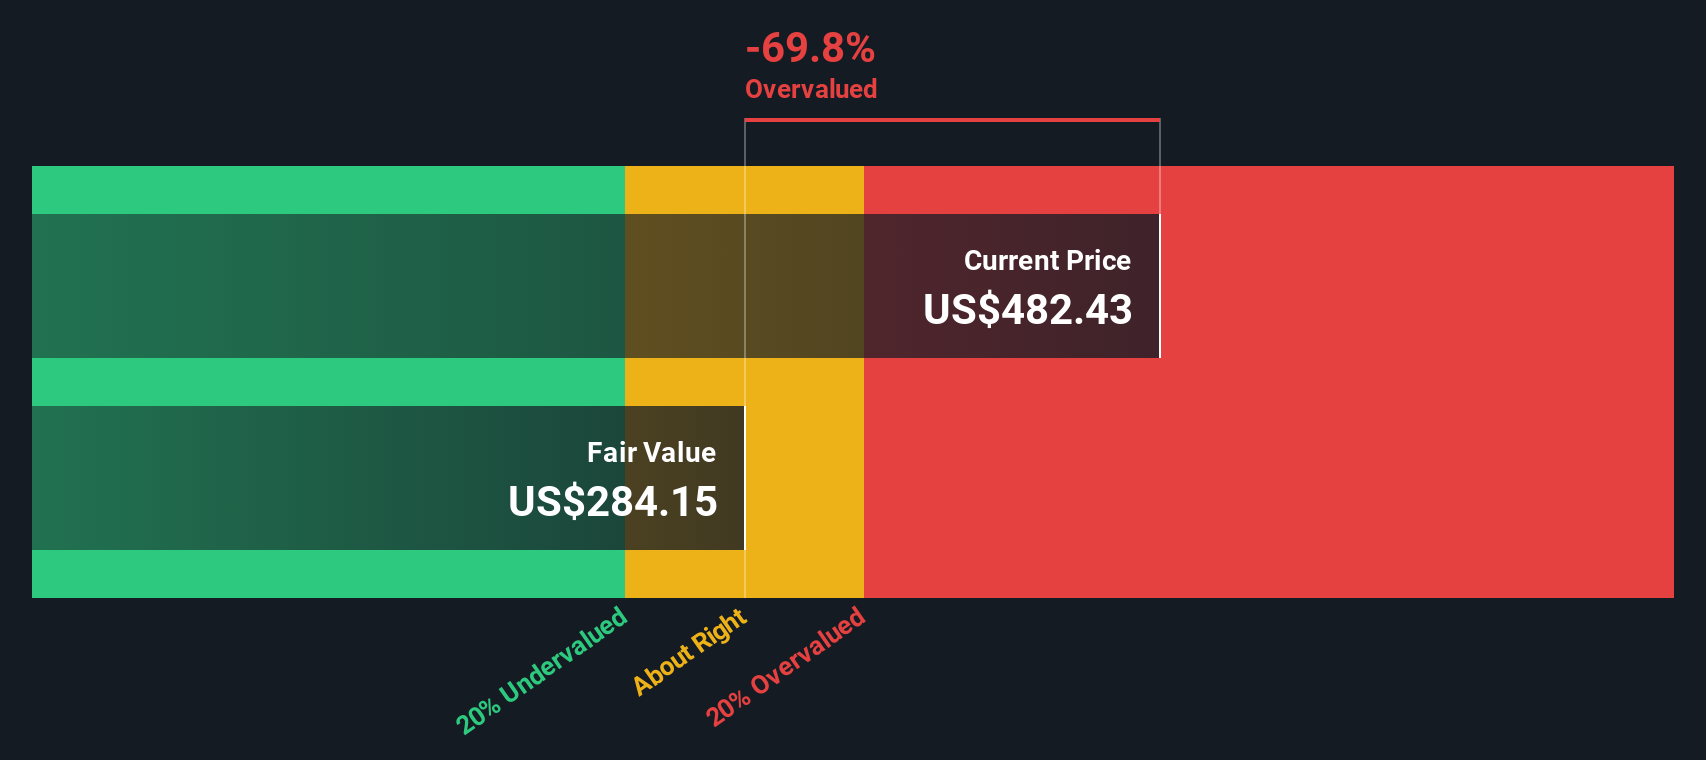
Another View on S&P Global's Valuation
Our DCF model paints a very different picture, suggesting fair value closer to $317 per share, meaning S&P Global could be significantly overvalued on a cash flow basis despite its strong track record. Is the market paying too much for quality, or rightly pricing long term growth?
Look into how the SWS DCF model arrives at its fair value.
Simply Wall St performs a discounted cash flow (DCF) on every stock in the world every day (check out S&P Global for example). We show the entire calculation in full. You can track the result in your watchlist or portfolio and be alerted when this changes, or use our stock screener to discover 901 undervalued stocks based on their cash flows. If you save a screener we even alert you when new companies match - so you never miss a potential opportunity.
Build Your Own S&P Global Narrative
If you see the story differently or want to dig into the numbers yourself, you can build a personalized view in just minutes: Do it your way.
A good starting point is our analysis highlighting 2 key rewards investors are optimistic about regarding S&P Global.
Looking for more investment ideas?
Before you move on, consider identifying your next smart move by scanning a few focused stock ideas that match different strategies and risk profiles using our screener.
- Explore potential mispricings by targeting companies trading below what their cash flows suggest with these 901 undervalued stocks based on cash flows.
- Focus on the next wave of innovation by examining these 24 AI penny stocks that are reshaping industries with intelligent automation.
- Identify dependable income streams by filtering for these 10 dividend stocks with yields > 3% that may help diversify your portfolio with regular cash distributions.
This article by Simply Wall St is general in nature. We provide commentary based on historical data and analyst forecasts only using an unbiased methodology and our articles are not intended to be financial advice. It does not constitute a recommendation to buy or sell any stock, and does not take account of your objectives, or your financial situation. We aim to bring you long-term focused analysis driven by fundamental data. Note that our analysis may not factor in the latest price-sensitive company announcements or qualitative material. Simply Wall St has no position in any stocks mentioned.
Have feedback on this article? Concerned about the content? Get in touch with us directly. Alternatively, email editorial-team@simplywallst.com