
- LIVE QUOTES
- LEARN
- HELP
 Nasdaq
 Wall Street Journal
EN
3 TSX Penny Stocks With Market Caps Under CA$200M To Consider
As the Canadian market navigates a noisy finish to 2025, with encouraging signs of easing inflation and stabilizing labor conditions, investors are eyeing a constructive outlook for 2026. In this context, penny stocks—though an outdated term—continue to capture interest due to their potential for significant growth when backed by strong financials. These smaller or newer companies can offer unique opportunities for those looking to invest in under-the-radar firms with promising long-term prospects.
Top 10 Penny Stocks In Canada
| Name | Share Price | Market Cap | Rewards & Risks |
| Westbridge Renewable Energy (TSXV:WEB) | CA$2.15 | CA$54.35M | ✅ 3 ⚠️ 4 View Analysis > |
| Canso Select Opportunities (TSXV:CSOC.A) | CA$4.75 | CA$21.97M | ✅ 2 ⚠️ 2 View Analysis > |
| Sailfish Royalty (TSXV:FISH) | CA$3.48 | CA$263.31M | ✅ 1 ⚠️ 4 View Analysis > |
| Zoomd Technologies (TSXV:ZOMD) | CA$1.145 | CA$115.41M | ✅ 4 ⚠️ 2 View Analysis > |
| Montero Mining and Exploration (TSXV:MON) | CA$0.43 | CA$3.59M | ✅ 2 ⚠️ 4 View Analysis > |
| CEMATRIX (TSX:CEMX) | CA$0.335 | CA$50.24M | ✅ 3 ⚠️ 1 View Analysis > |
| Thor Explorations (TSXV:THX) | CA$1.37 | CA$911.46M | ✅ 3 ⚠️ 2 View Analysis > |
| Automotive Finco (TSXV:AFCC.H) | CA$1.17 | CA$23.19M | ✅ 2 ⚠️ 3 View Analysis > |
| Pulse Seismic (TSX:PSD) | CA$3.20 | CA$162.31M | ✅ 2 ⚠️ 1 View Analysis > |
| Hemisphere Energy (TSXV:HME) | CA$1.97 | CA$186.41M | ✅ 3 ⚠️ 2 View Analysis > |
Click here to see the full list of 394 stocks from our TSX Penny Stocks screener.
Below we spotlight a couple of our favorites from our exclusive screener.
Base Carbon (NEOE:BCBN)
Simply Wall St Financial Health Rating: ★★★★★★
Overview: Base Carbon Inc., along with its subsidiaries, offers capital, development expertise, and management operating resources, with a market cap of CA$105.02 million.
Operations: The company generates revenue of $6.21 million from the development and deployment of its projects.
Market Cap: CA$105.02M
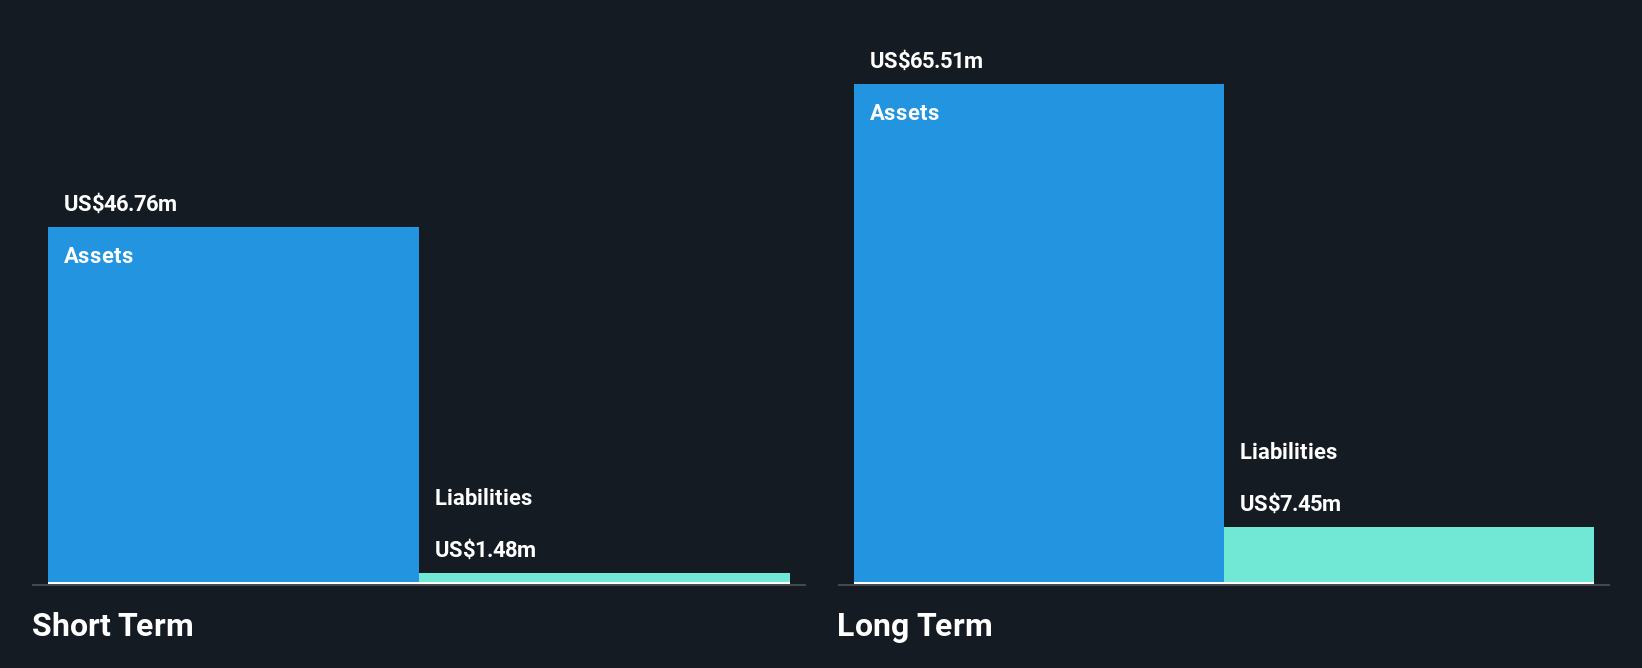
Base Carbon Inc. recently reported a net income of US$1.61 million for Q3 2025, marking a significant improvement from the previous year. Despite this, the company remains unprofitable over the long term with declining revenues and earnings over five years at 31.2% annually. The company benefits from no debt and strong short-term assets of CA$46.4 million exceeding liabilities, providing financial stability amidst volatility in its stock performance. Its management and board are experienced with average tenures of 3.2 and 3.8 years respectively, which could be advantageous as they navigate ongoing challenges in revenue growth and profitability.
- Unlock comprehensive insights into our analysis of Base Carbon stock in this financial health report.
- Assess Base Carbon's previous results with our detailed historical performance reports.
Minco Silver (TSX:MSV)
Simply Wall St Financial Health Rating: ★★★★★★
Overview: Minco Silver Corporation focuses on the exploration, evaluation, and development of precious metal and mineral properties, with a market cap of CA$41.29 million.
Operations: Minco Silver Corporation does not report any specific revenue segments.
Market Cap: CA$41.29M
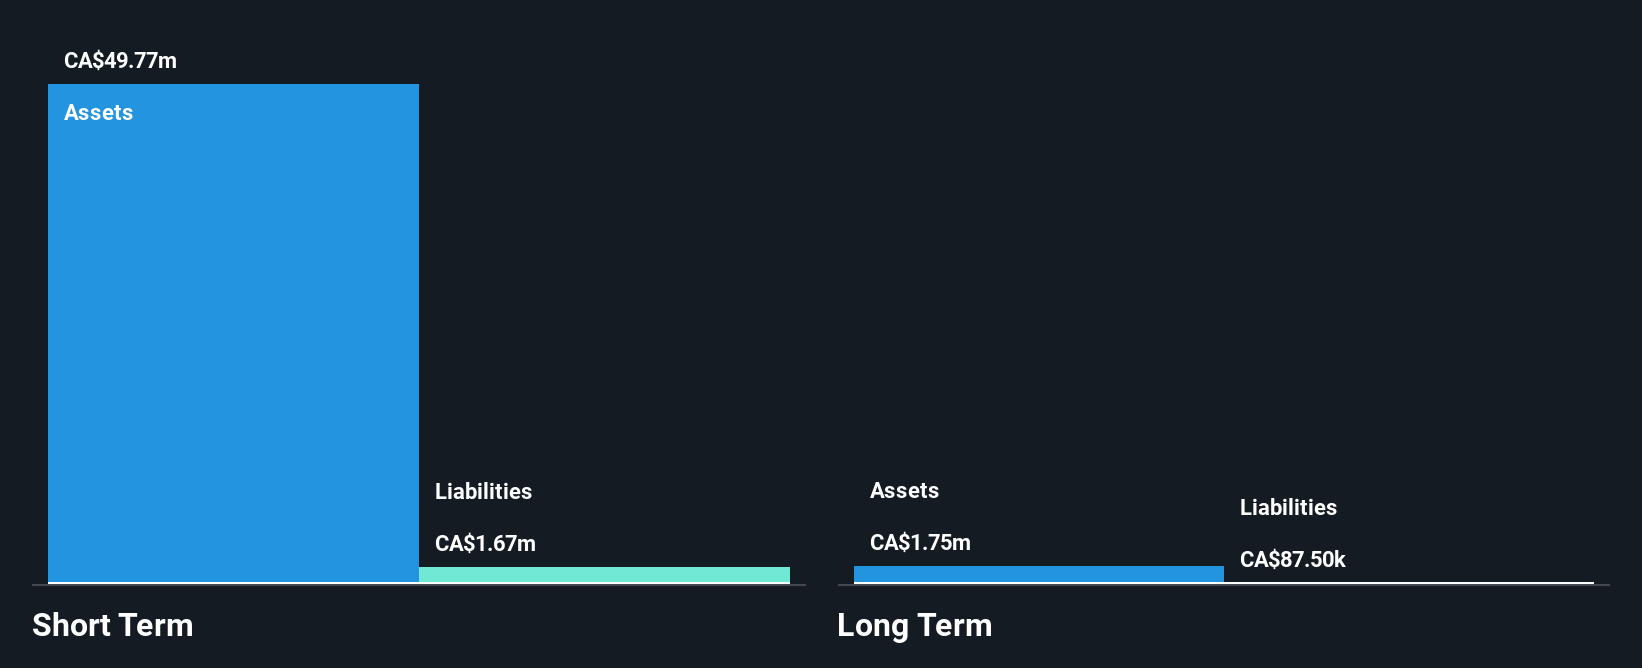
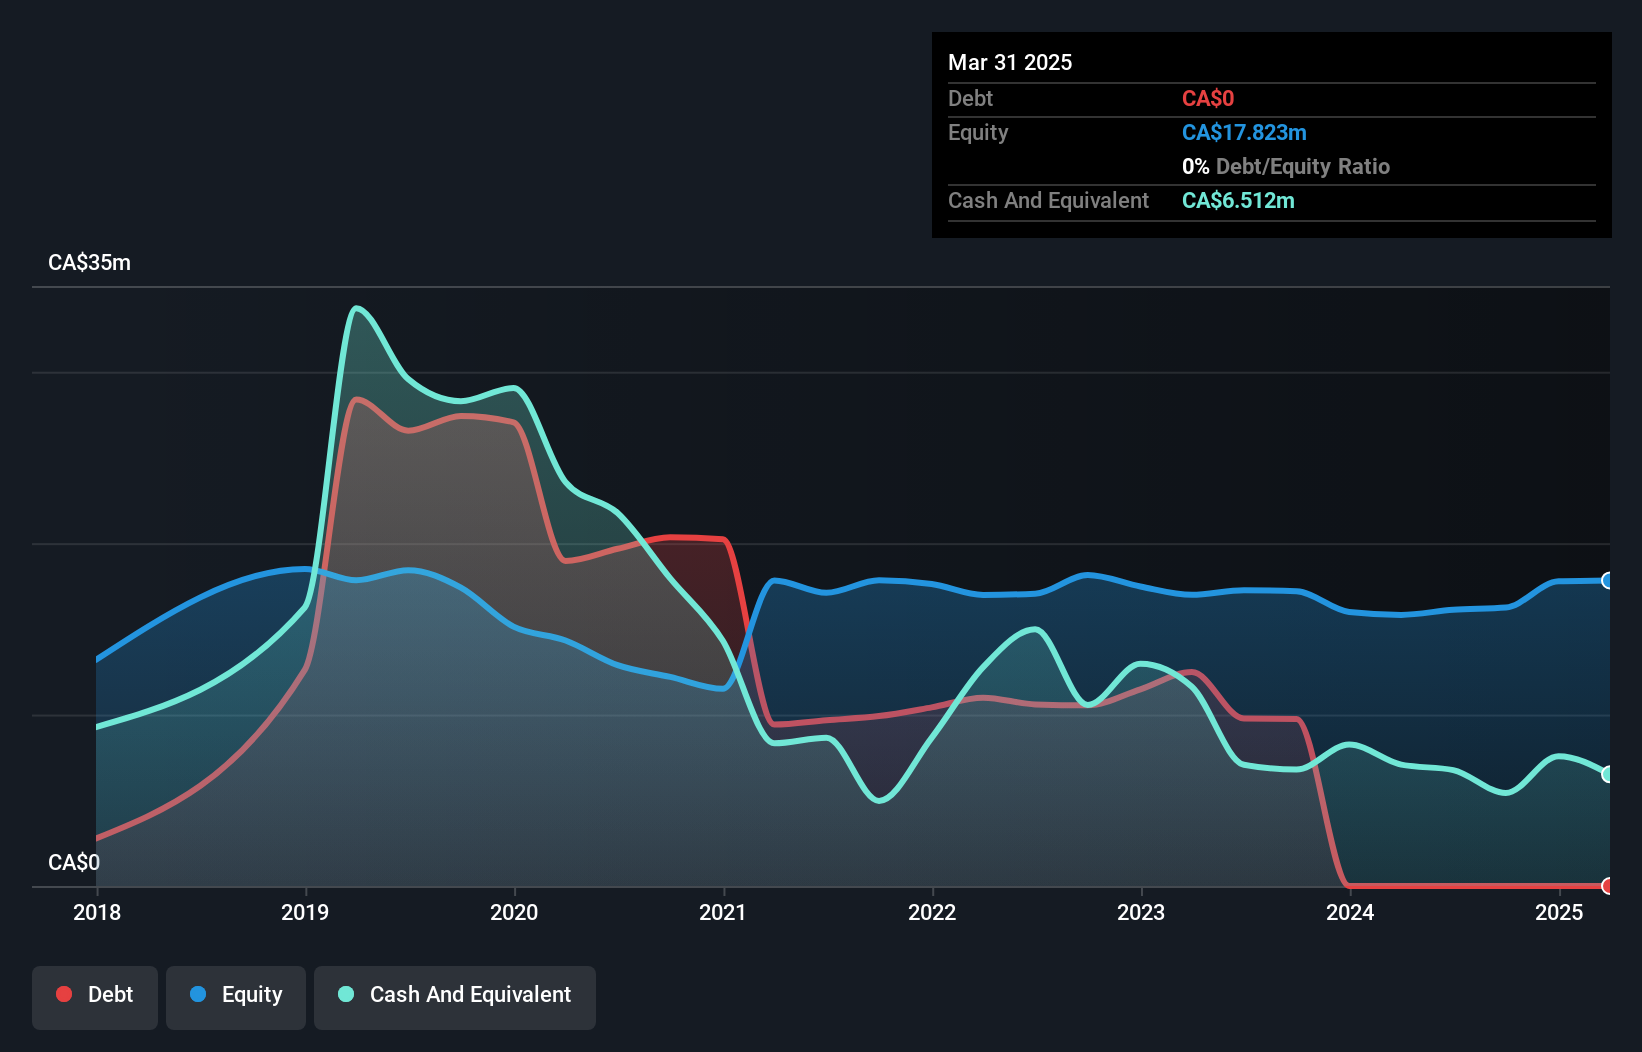
Minco Silver Corporation has transitioned to profitability, reporting a net income of CA$7.17 million for the first nine months of 2025, compared to a loss the previous year. Despite being pre-revenue with less than US$1 million in revenue, its financial health is robust due to no debt and short-term assets of CA$49.8 million surpassing both short and long-term liabilities significantly. The company's experienced board, with an average tenure of 15.1 years, supports stability amidst high share price volatility and low return on equity at 17.5%. Its price-to-earnings ratio is attractively low compared to the Canadian market average.
- Click here and access our complete financial health analysis report to understand the dynamics of Minco Silver.
- Evaluate Minco Silver's historical performance by accessing our past performance report.
Mene (TSXV:MENE)
Simply Wall St Financial Health Rating: ★★★★★★
Overview: Mene Inc. designs, manufactures, and markets 24 karat gold and platinum jewelry globally with a market cap of CA$46.94 million.
Operations: The company's revenue is derived from its Jewelry & Watches segment, totaling CA$27.99 million.
Market Cap: CA$46.94M
Mene Inc. operates in the jewelry market with a market cap of CA$46.94 million, reporting sales of CA$18.87 million for the first nine months of 2025, an increase from the previous year. Despite being unprofitable, it maintains a positive cash flow and has more than three years of cash runway without debt concerns. The management and board are experienced, though share price volatility remains high compared to most Canadian stocks. Short-term assets significantly exceed liabilities, indicating strong financial health despite recent net losses and negative return on equity at -8.95%. The stock trades below its estimated fair value.
- Click here to discover the nuances of Mene with our detailed analytical financial health report.
- Explore historical data to track Mene's performance over time in our past results report.
Turning Ideas Into Actions
- Discover the full array of 394 TSX Penny Stocks right here.
- Seeking Other Investments? Find companies with promising cash flow potential yet trading below their fair value.
This article by Simply Wall St is general in nature. We provide commentary based on historical data and analyst forecasts only using an unbiased methodology and our articles are not intended to be financial advice. It does not constitute a recommendation to buy or sell any stock, and does not take account of your objectives, or your financial situation. We aim to bring you long-term focused analysis driven by fundamental data. Note that our analysis may not factor in the latest price-sensitive company announcements or qualitative material. Simply Wall St has no position in any stocks mentioned.
Have feedback on this article? Concerned about the content? Get in touch with us directly. Alternatively, email editorial-team@simplywallst.com