
- LIVE QUOTES
- LEARN
- HELP
 Nasdaq
 Wall Street Journal
EN
Lincoln National (LNC): Valuation Check After New Capital Group ETF Indexed Annuity Launch and Improving Sentiment
Lincoln National (LNC) just rolled out a new Capital Group ETF indexed account for its fixed indexed annuities, pairing equity exposure with full downside protection, and the timing lines up neatly with improving sentiment around the stock.
See our latest analysis for Lincoln National.
That innovation is landing into a stock that has already been rebuilding confidence, with a 44.5% year to date share price return and a 52.8% one year total shareholder return suggesting momentum is firmly picking up rather than fading.
If this kind of improving sentiment has your attention, it could be a good moment to see what else is working in financials and beyond via fast growing stocks with high insider ownership.
Yet with the shares now hovering near analyst targets after a powerful rebound, is Lincoln National still trading at a discount to its intrinsic value, or is the market already pricing in the next leg of growth?
Most Popular Narrative Narrative: 4.6% Overvalued
With Lincoln National closing at $46.01 against a narrative fair value of about $44, the story leans toward modest optimism but not deep mispricing.
The analysts have a consensus price target of $41.727 for Lincoln National based on their expectations of its future earnings growth, profit margins and other risk factors. However, there is a degree of disagreement amongst analysts, with the most bullish reporting a price target of $52.0, and the most bearish reporting a price target of just $37.0.
Want to see how a slow burn in revenues, a carefully managed margin lift, and a restrained future earnings multiple still add up to this valuation puzzle?
Result: Fair Value of $44 (OVERVALUED)
Have a read of the narrative in full and understand what's behind the forecasts.
However, lingering legacy variable annuity exposure and structural outflows in Retirement Plan Services could quickly challenge the market's growing confidence in this turnaround.
Find out about the key risks to this Lincoln National narrative.
Another Lens on Value
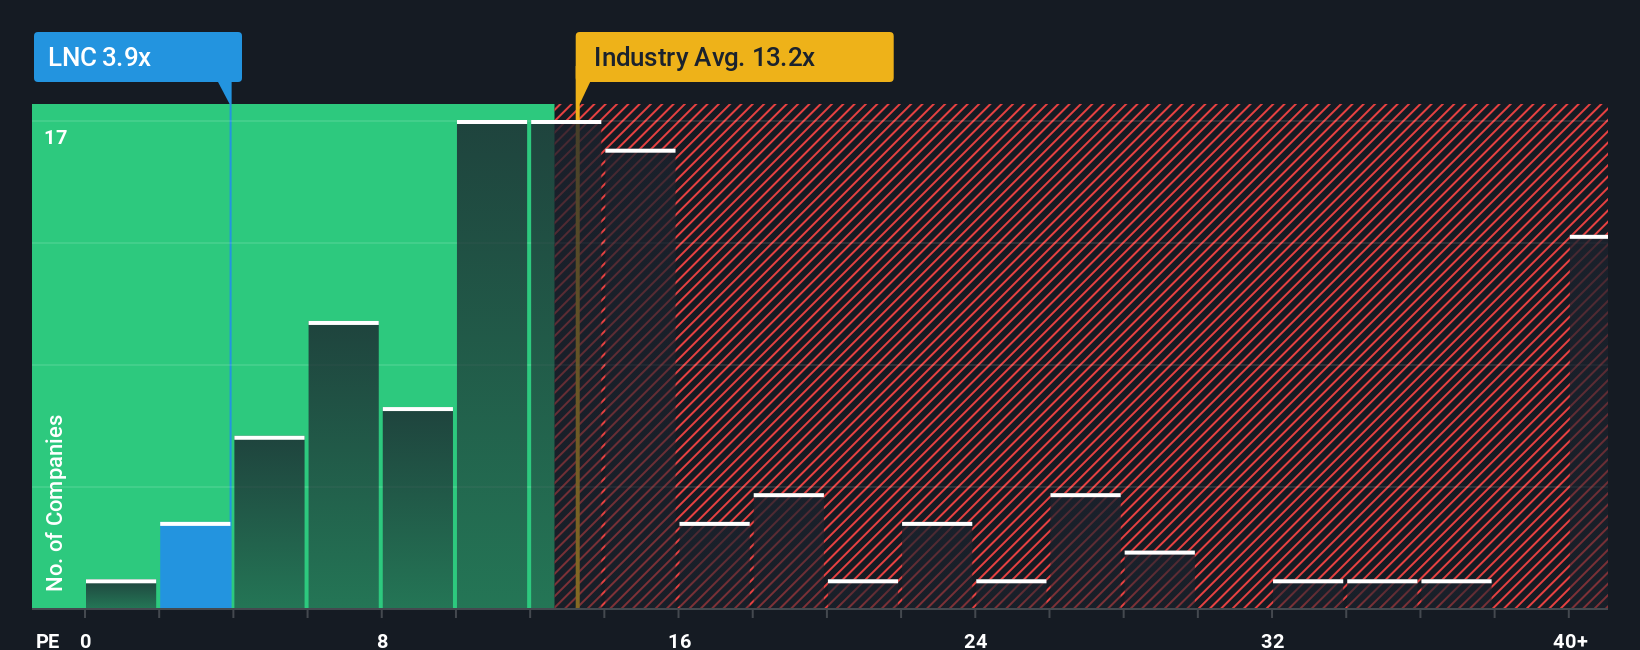
While the narrative fair value suggests Lincoln National is modestly overvalued at around $44, its earnings multiple tells a different story. At 4.3 times earnings versus 12.7 times for peers and a fair ratio of 12.6 times, the gap hints at sizable upside if sentiment truly normalizes. Or is the discount a warning flag instead of an opportunity?
See what the numbers say about this price — find out in our valuation breakdown.
Build Your Own Lincoln National Narrative
If you see things differently or want to stress test the story against your own assumptions, build a custom view in minutes: Do it your way.
A great starting point for your Lincoln National research is our analysis highlighting 3 key rewards and 2 important warning signs that could impact your investment decision.
Ready for your next investing move?
Before the market’s next swing, tap into fresh ideas beyond Lincoln National and put Simply Wall Street’s powerful screeners to work for your watchlist.
- Capture high-upside potential by targeting beaten down opportunities using these 904 undervalued stocks based on cash flows to spot companies whose cash flows suggest the market is still asleep.
- Ride structural growth trends by scanning these 24 AI penny stocks for businesses reshaping industries with intelligent automation and scalable digital platforms.
- Strengthen your income game by reviewing these 10 dividend stocks with yields > 3% to explore yields that could meaningfully influence your total return over time.
This article by Simply Wall St is general in nature. We provide commentary based on historical data and analyst forecasts only using an unbiased methodology and our articles are not intended to be financial advice. It does not constitute a recommendation to buy or sell any stock, and does not take account of your objectives, or your financial situation. We aim to bring you long-term focused analysis driven by fundamental data. Note that our analysis may not factor in the latest price-sensitive company announcements or qualitative material. Simply Wall St has no position in any stocks mentioned.
Have feedback on this article? Concerned about the content? Get in touch with us directly. Alternatively, email editorial-team@simplywallst.com