
- LIVE QUOTES
- LEARN
- HELP
 Nasdaq
 Wall Street Journal
EN
Seibu Holdings (TSE:9024) Valuation After Retiring 5.47% of Shares in Capital Structure Optimization
Why Seibu Holdings is retiring shares now
Seibu Holdings (TSE:9024) has moved from buying back its stock to actually canceling it, with the board approving the retirement of roughly 5.47% of outstanding shares after its latest repurchase program.
This shift from simply holding treasury shares to permanently shrinking the share count signals a clearer commitment to capital efficiency, and it nudges each remaining share to represent a slightly larger slice of the company.
See our latest analysis for Seibu Holdings.
The upcoming share retirement caps a busy few weeks, with Seibu first wrapping up a sizable buyback and now leaning into capital returns. This comes even as the 1 year total shareholder return of 44.1% and 3 year total shareholder return of 222.5% show strong longer term momentum, despite the recent 30 day share price return of negative 10.75%.
If this kind of capital allocation story has your attention, it might be worth scanning fast growing stocks with high insider ownership to see which other companies are quietly building momentum behind the scenes.
Yet despite the buyback and share retirement, the stock trades below analyst targets after a strong multi year run. This raises the key question: is this a fresh entry point, or is the market already baking in future growth?
Price-to-Earnings of 5.6x: Is it justified?
On a last close of ¥4,400, Seibu Holdings trades on a price to earnings ratio of 5.6 times, suggesting a notable discount to both peers and the wider Japanese market.
The price to earnings multiple compares the current share price with the company’s earnings per share, making it a straightforward gauge of how much investors are paying for each unit of profit. For a diversified transportation and leisure group like Seibu, this metric is particularly relevant because it captures the profitability of its rail, hotel, real estate, and entertainment operations in a single figure.
Seibu’s 5.6 times price to earnings stands well below the Japanese transportation industry average of 12.1 times and the peer average of 13.1 times, which points to a market that is pricing its current earnings more conservatively than rivals. Yet that gap is not extreme when set against the estimated fair price to earnings ratio of 6 times. This is a level the market could gravitate toward if sentiment normalizes and earnings remain resilient.
Explore the SWS fair ratio for Seibu Holdings
Result: Price-to-Earnings of 5.6x (UNDERVALUED)
However, slowing revenue and sharply weaker net income growth suggest that if earnings momentum stalls, today’s low valuation could quickly look less compelling.
Find out about the key risks to this Seibu Holdings narrative.
Another way to look at value
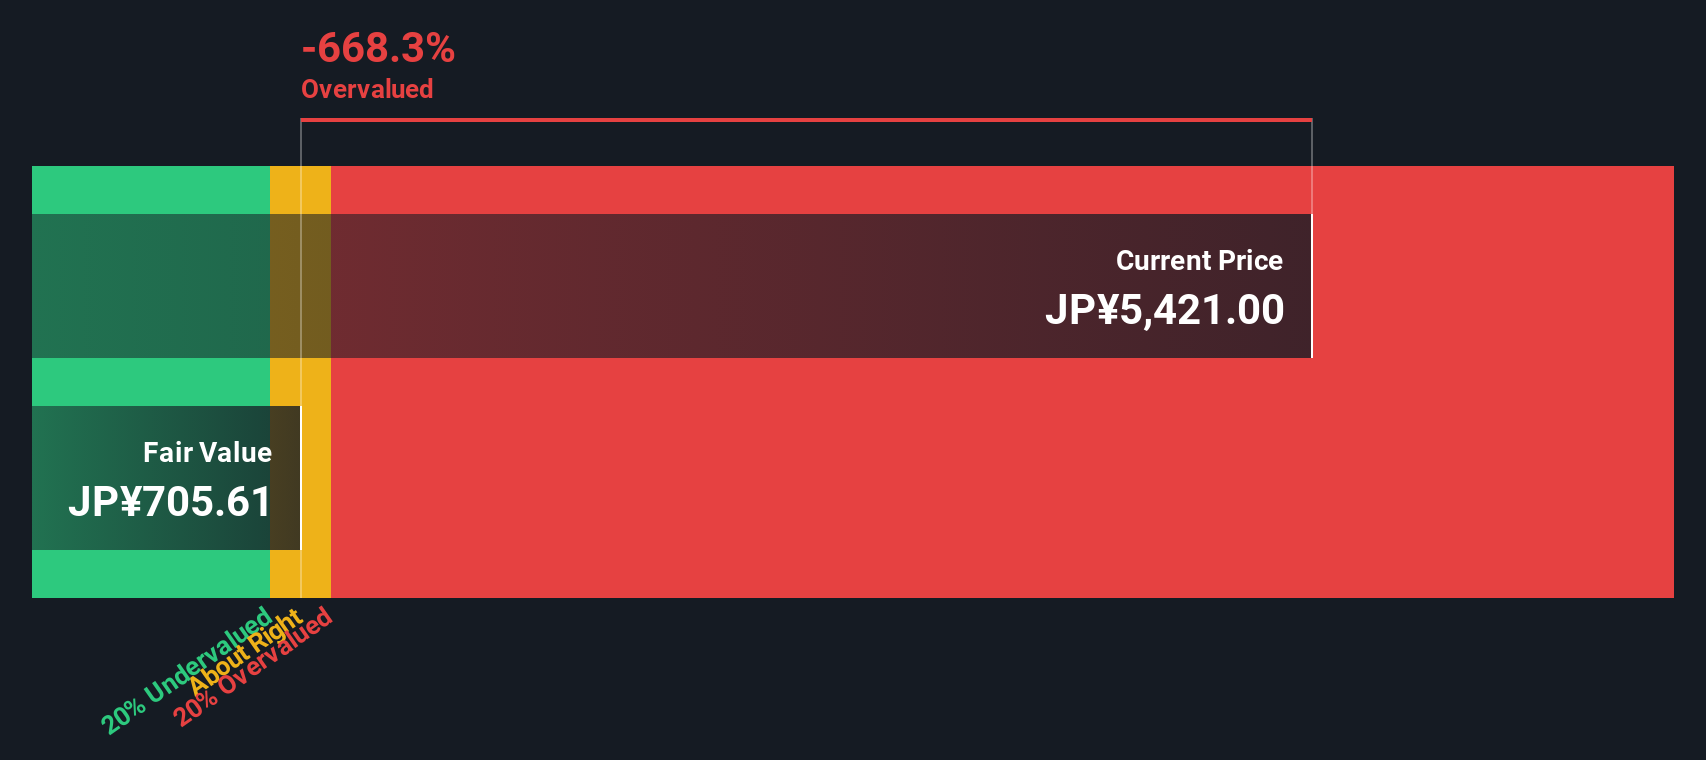
Our DCF model tells a very different story, with Seibu trading at ¥4,400 versus an estimated fair value of around ¥747, which screens as meaningfully overvalued. Is the market overestimating the durability of recent earnings, or is the model underestimating Seibu’s long term cash power?
Look into how the SWS DCF model arrives at its fair value.
Simply Wall St performs a discounted cash flow (DCF) on every stock in the world every day (check out Seibu Holdings for example). We show the entire calculation in full. You can track the result in your watchlist or portfolio and be alerted when this changes, or use our stock screener to discover 904 undervalued stocks based on their cash flows. If you save a screener we even alert you when new companies match - so you never miss a potential opportunity.
Build Your Own Seibu Holdings Narrative
If you see the numbers differently or want to stress test your own assumptions, you can build a full narrative in minutes, Do it your way.
A great starting point for your Seibu Holdings research is our analysis highlighting 3 key rewards and 2 important warning signs that could impact your investment decision.
Ready for more high conviction ideas?
Before you move on, lock in your next round of opportunities by using our screeners to uncover stocks that match your strategy with precision and discipline.
- Capture potential mispricings by targeting companies trading below intrinsic value through these 904 undervalued stocks based on cash flows, and position yourself ahead of a possible rerating.
- Ride powerful structural trends in automation and machine learning by focusing on these 24 AI penny stocks that pair innovation with real revenue traction.
- Strengthen your income stream by zeroing in on these 10 dividend stocks with yields > 3% that can help support long term total returns while markets stay unpredictable.
This article by Simply Wall St is general in nature. We provide commentary based on historical data and analyst forecasts only using an unbiased methodology and our articles are not intended to be financial advice. It does not constitute a recommendation to buy or sell any stock, and does not take account of your objectives, or your financial situation. We aim to bring you long-term focused analysis driven by fundamental data. Note that our analysis may not factor in the latest price-sensitive company announcements or qualitative material. Simply Wall St has no position in any stocks mentioned.
Have feedback on this article? Concerned about the content? Get in touch with us directly. Alternatively, email editorial-team@simplywallst.com