
- LIVE QUOTES
- LEARN
- HELP
 Nasdaq
 Wall Street Journal
EN
Is It Too Late To Consider Oracle After Its 155% Three Year Share Price Surge?
- If you are wondering whether Oracle is still a smart consideration at these levels, or if the easy gains are already behind it, you are in the right place to unpack what the current share price really implies.
- After climbing 10.7% over the last week and delivering a 155.1% return over three years, Oracle now trades around $197.49. This puts its 18.9% year-to-date gain and 16.4% 1-year return into sharper focus, despite a recent 1.4% dip over the past month.
- Investors have been reacting to Oracle's aggressive push into cloud infrastructure and AI-focused database services, as the company deepens partnerships with major hyperscalers to host its database technology. At the same time, headlines around expanded AI workloads and migration deals from legacy on-premise systems have reinforced the idea that Oracle is repositioning itself at the center of long-term enterprise data demand.
- Right now, Oracle scores just 2/6 on our undervaluation checks, which suggests the market may already be pricing in much of that transformation. Next, we will walk through what different valuation approaches say about the stock today and finish with a more nuanced way to think about Oracle's current worth.
Oracle scores just 2/6 on our valuation checks. See what other red flags we found in the full valuation breakdown.
Approach 1: Oracle Discounted Cash Flow (DCF) Analysis
A Discounted Cash Flow, or DCF, model estimates what a company is worth today by projecting its future cash flows and then discounting those back to a present value.
For Oracle, the latest twelve month Free Cash Flow stands at about $2.9 Billion. Analysts and model assumptions see this building significantly over time, with projected Free Cash Flow reaching roughly $22.7 Billion by 2030, based on a 2 Stage Free Cash Flow to Equity framework. Early years include some negative projected cash flows, followed by a steep recovery and steady growth, reflecting heavy investment before higher payoff, with long term estimates extrapolated beyond analyst coverage.
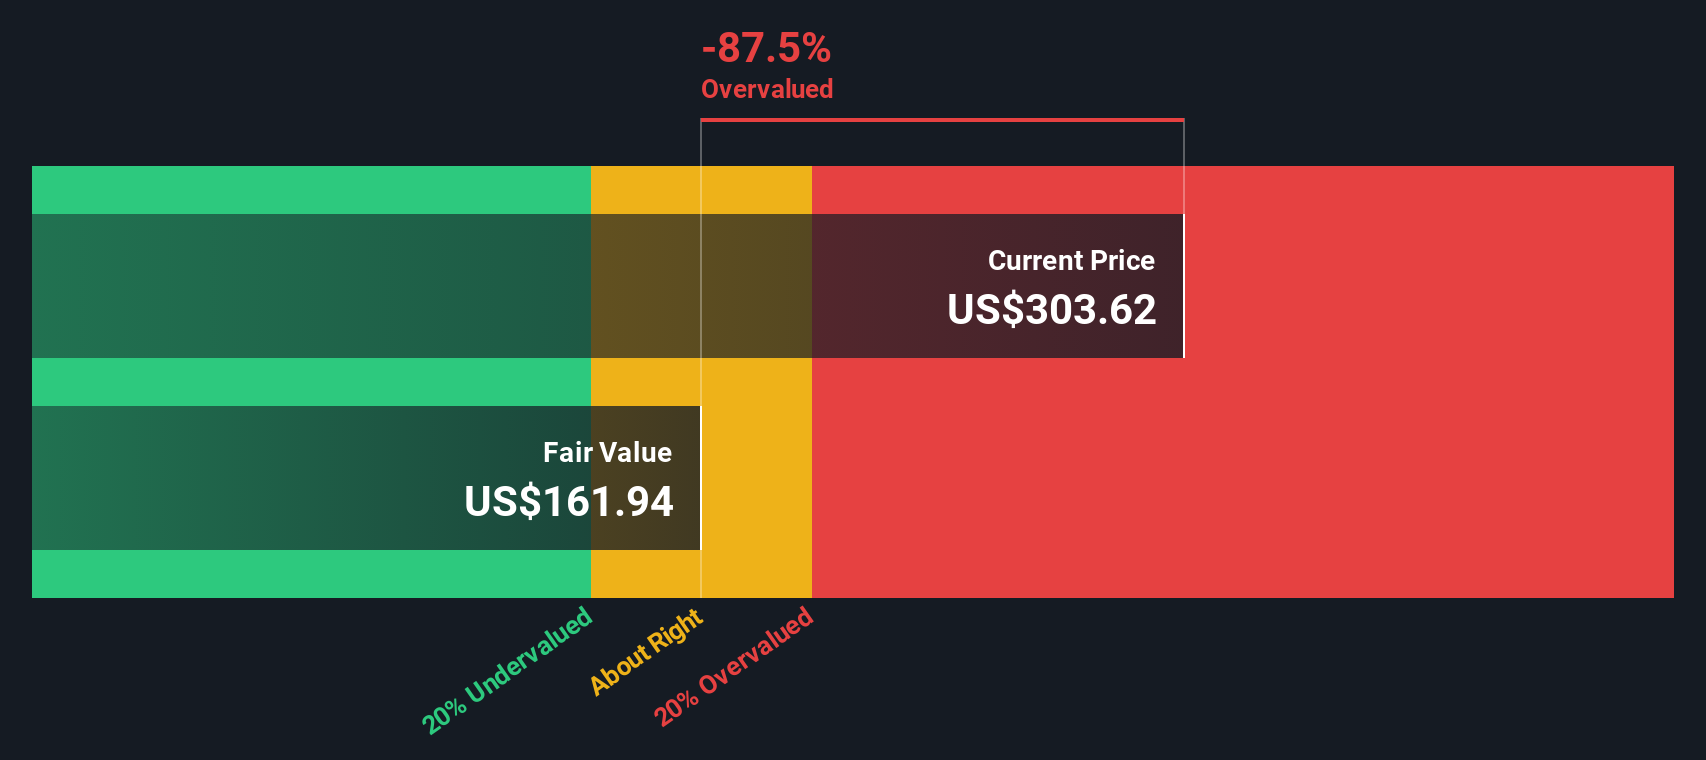
Pulling those cash flows together, Simply Wall St arrives at an intrinsic value of about $165.49 per share, compared with a current price near $197.49. That implies Oracle is roughly 19.3% overvalued on this DCF view, which suggests that expectations for future growth and profitability are already quite optimistic in the current share price.
Result: OVERVALUED
Our Discounted Cash Flow (DCF) analysis suggests Oracle may be overvalued by 19.3%. Discover 904 undervalued stocks or create your own screener to find better value opportunities.
Approach 2: Oracle Price vs Earnings
For a mature, profitable business like Oracle, the Price to Earnings, or PE, ratio is a practical way to gauge how much investors are willing to pay today for each dollar of current earnings. In general, faster earnings growth and lower perceived risk justify a higher, or more generous, PE multiple, while slower growth or elevated risk should pull that multiple down.
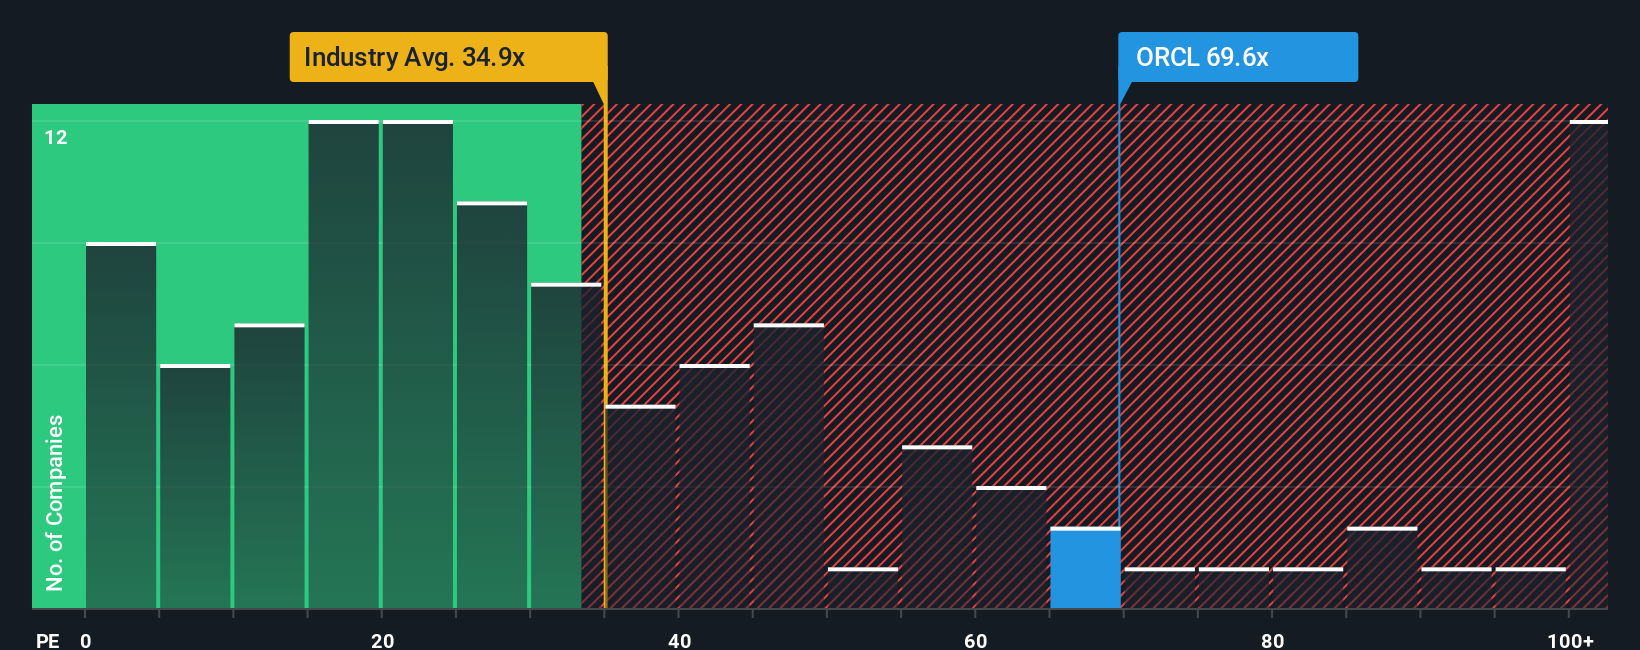
Oracle currently trades on a PE of about 36.79x. That is above the broader Software industry average of roughly 31.89x, but well below the 68.77x average of its closest peers. This reflects the market viewing Oracle as higher quality than the typical software name, but not as aggressively valued as the fastest growing group. To refine this view, Simply Wall St uses a proprietary Fair Ratio, which estimates what PE multiple is reasonable given Oracle's specific earnings growth outlook, profitability, industry, size, and risk profile. This Fair Ratio, at around 54.38x, is more informative than simple peer or sector comparisons because it adjusts for Oracle's own fundamentals rather than assuming it should match a broad average.
Comparing the Fair Ratio of 54.38x with the current 36.79x PE suggests the market is still applying a discount to Oracle's fundamentals, pointing to undervaluation on this metric.
Result: UNDERVALUED
PE ratios tell one story, but what if the real opportunity lies elsewhere? Discover 1460 companies where insiders are betting big on explosive growth.
Upgrade Your Decision Making: Choose your Oracle Narrative
Earlier we mentioned that there is an even better way to understand valuation, so let us introduce you to Narratives, a simple way for you to connect your view of Oracle’s story to a concrete forecast and Fair Value. You can do this by specifying what you believe about its future revenue, earnings, and margins, and then comparing that Fair Value to today’s price to consider whether to buy, hold, or sell.
On Simply Wall St, Narratives live on the Community page and are used by millions of investors as an accessible tool that turns qualitative views into numbers, links those numbers to a clear valuation, and then keeps that view up to date as new information such as earnings or major news is released.
For Oracle, one Narrative on the platform might assume hypergrowth in AI infrastructure and assign a Fair Value around $389.81. Another more conservative Narrative might focus on steady cloud adoption and slower expansion, resulting in a Fair Value closer to $212.00. This illustrates how different, reasonable perspectives can lead to very different conclusions about whether the current share price represents opportunity or risk.
Do you think there's more to the story for Oracle? Head over to our Community to see what others are saying!

This article by Simply Wall St is general in nature. We provide commentary based on historical data and analyst forecasts only using an unbiased methodology and our articles are not intended to be financial advice. It does not constitute a recommendation to buy or sell any stock, and does not take account of your objectives, or your financial situation. We aim to bring you long-term focused analysis driven by fundamental data. Note that our analysis may not factor in the latest price-sensitive company announcements or qualitative material. Simply Wall St has no position in any stocks mentioned.
Have feedback on this article? Concerned about the content? Get in touch with us directly. Alternatively, email editorial-team@simplywallst.com