
- LIVE QUOTES
- LEARN
- HELP
 Nasdaq
 Wall Street Journal
EN
Does Allstate Still Offer Upside After Its Strong 118.6% Five Year Share Price Gain?
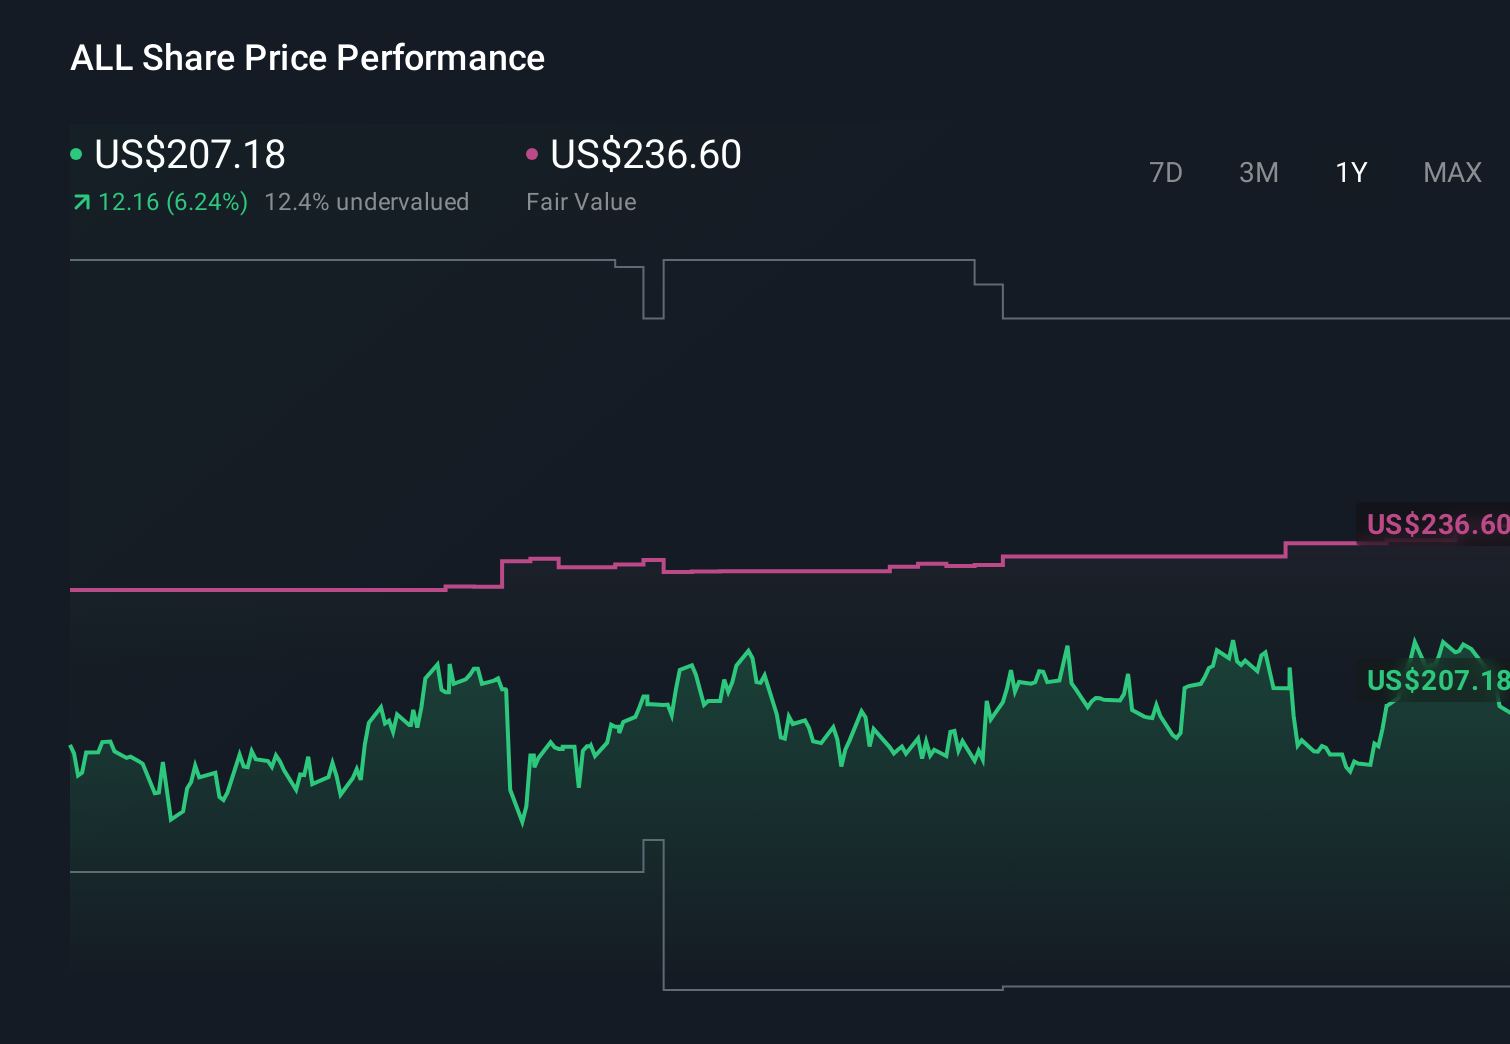
- Many investors are asking whether Allstate at around $209 a share is still a smart buy or if most of the upside is already priced in. This article unpacks that question in detail.
- Despite a relatively flat 7 day move and a modest 1.6% dip over the last month, Allstate is still up 8.9% year to date and 118.6% over 5 years. This indicates that long term holders have been rewarded even if short term action looks quieter.
- Recently, the stock has been in focus as investors reassess large US insurers in light of shifting catastrophe risk, property and casualty pricing, and ongoing debates about how climate exposure and regulatory changes could affect long term profitability. At the same time, sector wide scrutiny of underwriting standards and capital buffers has made Allstate a key name for those trying to balance growth potential with risk management quality.
- On our checks, Allstate scores 5/6 on valuation, suggesting it screens as undervalued on most of the yardsticks we use, while still leaving room for debate on how the market should be pricing its future. Next, we walk through the standard valuation approaches investors lean on, then finish with a more holistic way to think about what Allstate may be worth and how that might change over time.
Approach 1: Allstate Excess Returns Analysis
The Excess Returns model looks at how effectively Allstate turns its equity base into profits above its required cost of capital, then capitalizes those excess profits into an intrinsic value per share.
In this framework, Allstate starts with a Book Value of $97.34 per share and is expected to generate Stable EPS of $29.24 per share, based on weighted future Return on Equity estimates from 13 analysts. With a Cost of Equity of $8.65 per share, that implies an Excess Return of $20.58 per share, meaning the company is projected to earn more than investors require for taking on its risk.
The Average Return on Equity of 23.50, together with a Stable Book Value forecast of $124.39 per share from 12 analysts, supports an earnings power that the model translates into an intrinsic value of about $681 per share. Compared with the current share price around $209, this indicates Allstate trading at roughly a 69.3% discount on this measure.
Result: UNDERVALUED
Our Excess Returns analysis suggests Allstate is undervalued by 69.3%. Track this in your watchlist or portfolio, or discover 904 more undervalued stocks based on cash flows.

Approach 2: Allstate Price vs Earnings
For a profitable insurer like Allstate, the price to earnings ratio is a practical way to gauge whether investors are paying a reasonable price for each dollar of current earnings. In general, companies with faster expected growth and lower perceived risk can justify higher PE ratios, while slower, riskier names typically trade on lower multiples.
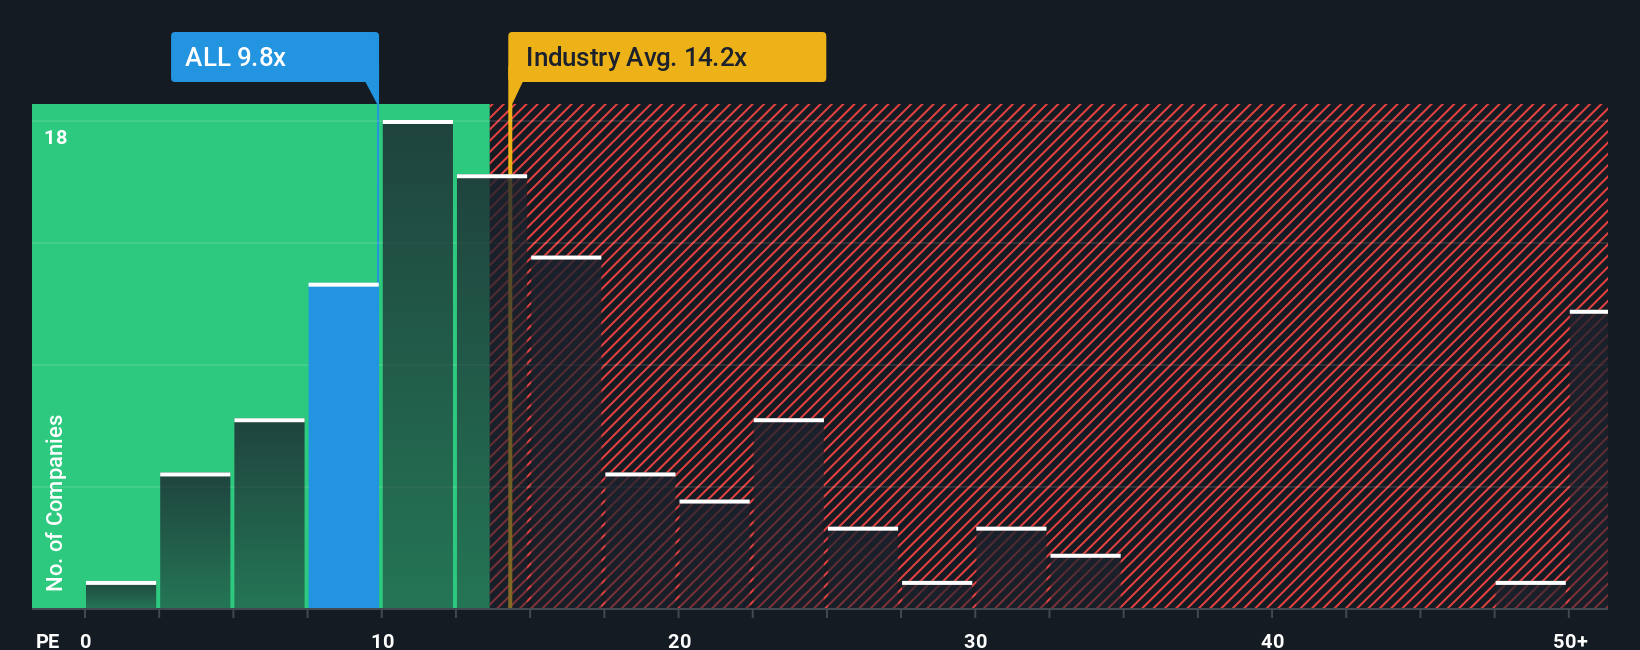
Allstate currently trades on a PE of about 6.6x, well below both the broader Insurance industry average of around 13.4x and the peer group average of roughly 12.9x. On the surface, that discount suggests the market is either skeptical about the durability of recent earnings or is still pricing in elevated risk relative to other insurers.
Simply Wall St’s Fair Ratio framework goes a step further by estimating what a reasonable PE should be for Allstate, given its earnings growth outlook, profitability, size, industry positioning and risk profile. On this basis, Allstate’s Fair Ratio comes out at about 9.5x, which is more informative than a simple comparison with sector averages because it is tailored to the company’s fundamentals. With the current PE of 6.6x sitting materially below the 9.5x Fair Ratio, the stock appears undervalued on this metric.
Result: UNDERVALUED
PE ratios tell one story, but what if the real opportunity lies elsewhere? Discover 1460 companies where insiders are betting big on explosive growth.
Upgrade Your Decision Making: Choose your Allstate Narrative
Earlier we mentioned that there is an even better way to understand valuation, so let us introduce you to Narratives, a simple idea where you attach a clear story about Allstate’s future to the numbers you care about, such as fair value, expected revenue, earnings and margins. You then link that story to a financial forecast and a resulting fair value estimate, all within an easy to use tool on Simply Wall St’s Community page that millions of investors already rely on to compare their Fair Value view with the current share price, decide whether they see Allstate as a buy or sell, and automatically have their Narrative updated when new earnings, news or guidance arrives. For example, one investor might build a bullish Narrative around accelerating digital product adoption, improving margins and a fair value closer to 275 dollars, while another could take a more cautious view focused on climate risk, regulatory headwinds and slower growth, and therefore land near 157 dollars, with both Narratives transparently showing how their assumptions drive the final valuation.
Do you think there's more to the story for Allstate? Head over to our Community to see what others are saying!
This article by Simply Wall St is general in nature. We provide commentary based on historical data and analyst forecasts only using an unbiased methodology and our articles are not intended to be financial advice. It does not constitute a recommendation to buy or sell any stock, and does not take account of your objectives, or your financial situation. We aim to bring you long-term focused analysis driven by fundamental data. Note that our analysis may not factor in the latest price-sensitive company announcements or qualitative material. Simply Wall St has no position in any stocks mentioned.
Have feedback on this article? Concerned about the content? Get in touch with us directly. Alternatively, email editorial-team@simplywallst.com