
- LIVE QUOTES
- LEARN
- HELP
 Nasdaq
 Wall Street Journal
EN
Does Bausch + Lomb’s Rising Focus on Eye Health Make Its Current Share Price Attractive?
- Wondering if Bausch + Lomb at around $17 a share is a hidden bargain or a value trap? This article will walk through the numbers in plain English so you can decide for yourself.
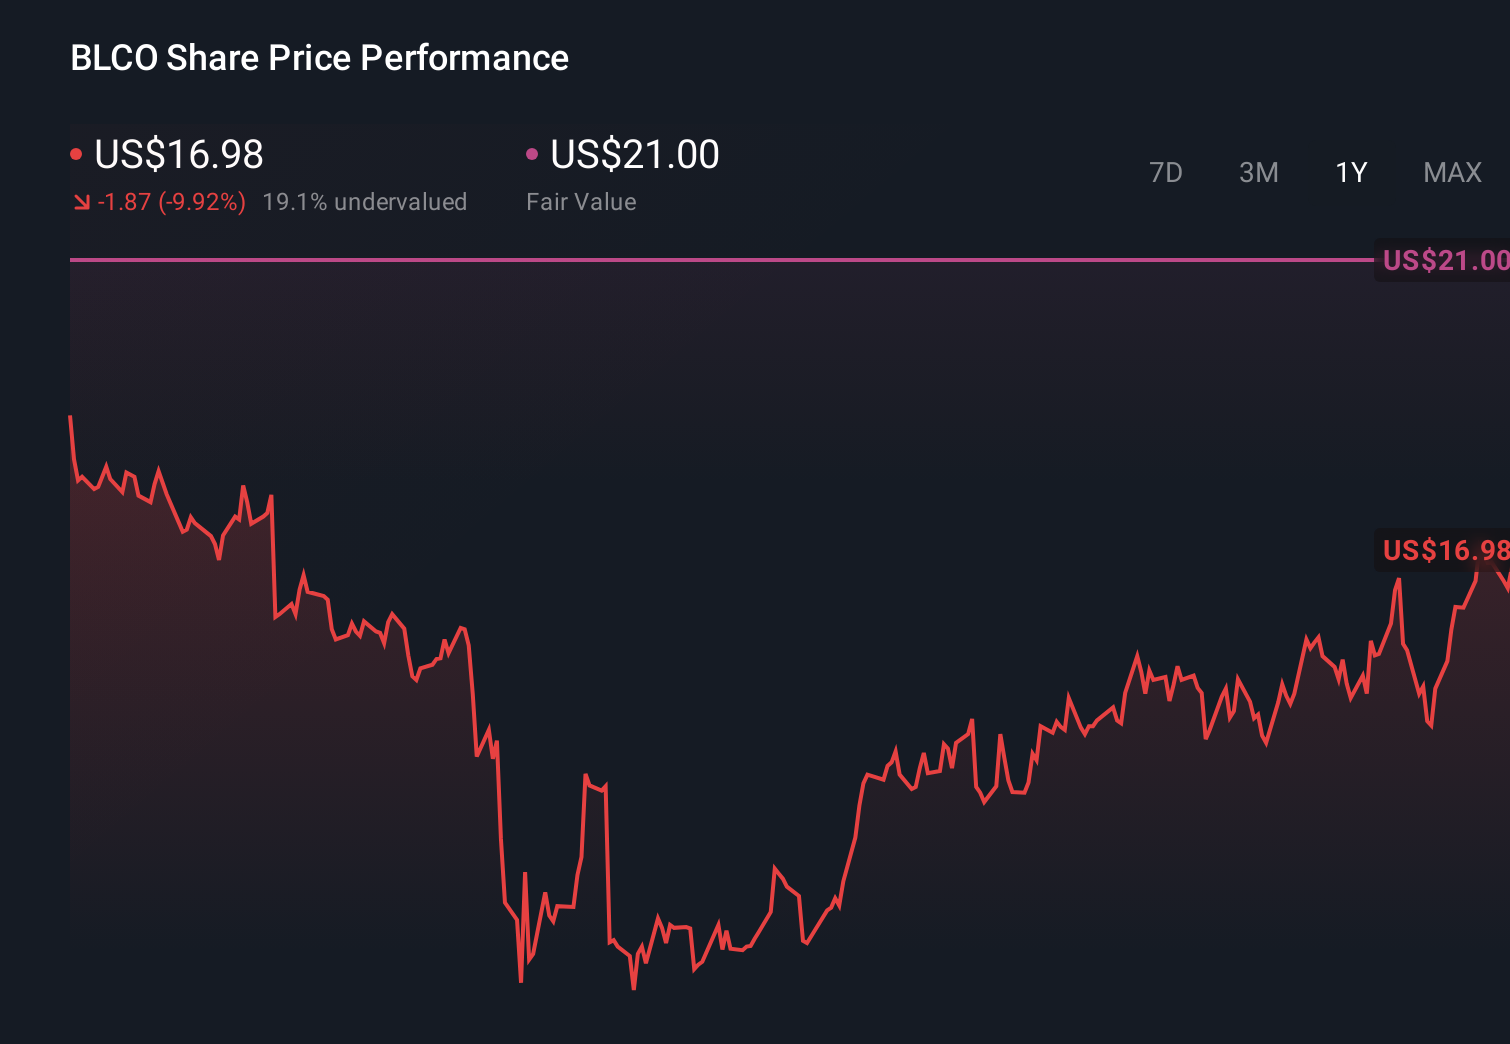
- The stock has inched up 0.8% over the last week and 10.1% across the past month, even though it is still down 5.5% year to date and 4.8% over the last year. This hints that sentiment might be shifting after a tougher stretch.
- Recent headlines have focused on Bausch + Lomb expanding its eye health portfolio and sharpening its focus on higher margin products. These moves can change how investors think about its long term earnings power. There has also been growing attention on the broader healthcare space as a defensive play, which can pull fresh interest toward established names like Bausch + Lomb.
- On our framework the stock scores a 5 out of 6 valuation check score. This suggests it screens as undervalued on most, but not all, of the metrics we track. We will unpack those methods next while also flagging a smarter, narrative driven way to think about valuation at the end of this article.
Find out why Bausch + Lomb's -4.8% return over the last year is lagging behind its peers.
Approach 1: Bausch + Lomb Discounted Cash Flow (DCF) Analysis
A Discounted Cash Flow (DCF) model estimates what a business is worth today by projecting the cash it could generate in the future and then discounting those cash flows back to the present.
For Bausch + Lomb, the latest twelve month Free Cash Flow (FCF) is currently negative at around $121 million, which reflects ongoing investment and margin pressure. Looking ahead, analyst forecasts and extensions used by Simply Wall St indicate a sharp improvement, with FCF expected to rise to about $440 million by 2026 and roughly $913 million by 2035, assuming the eye health portfolio scales and profitability improves.
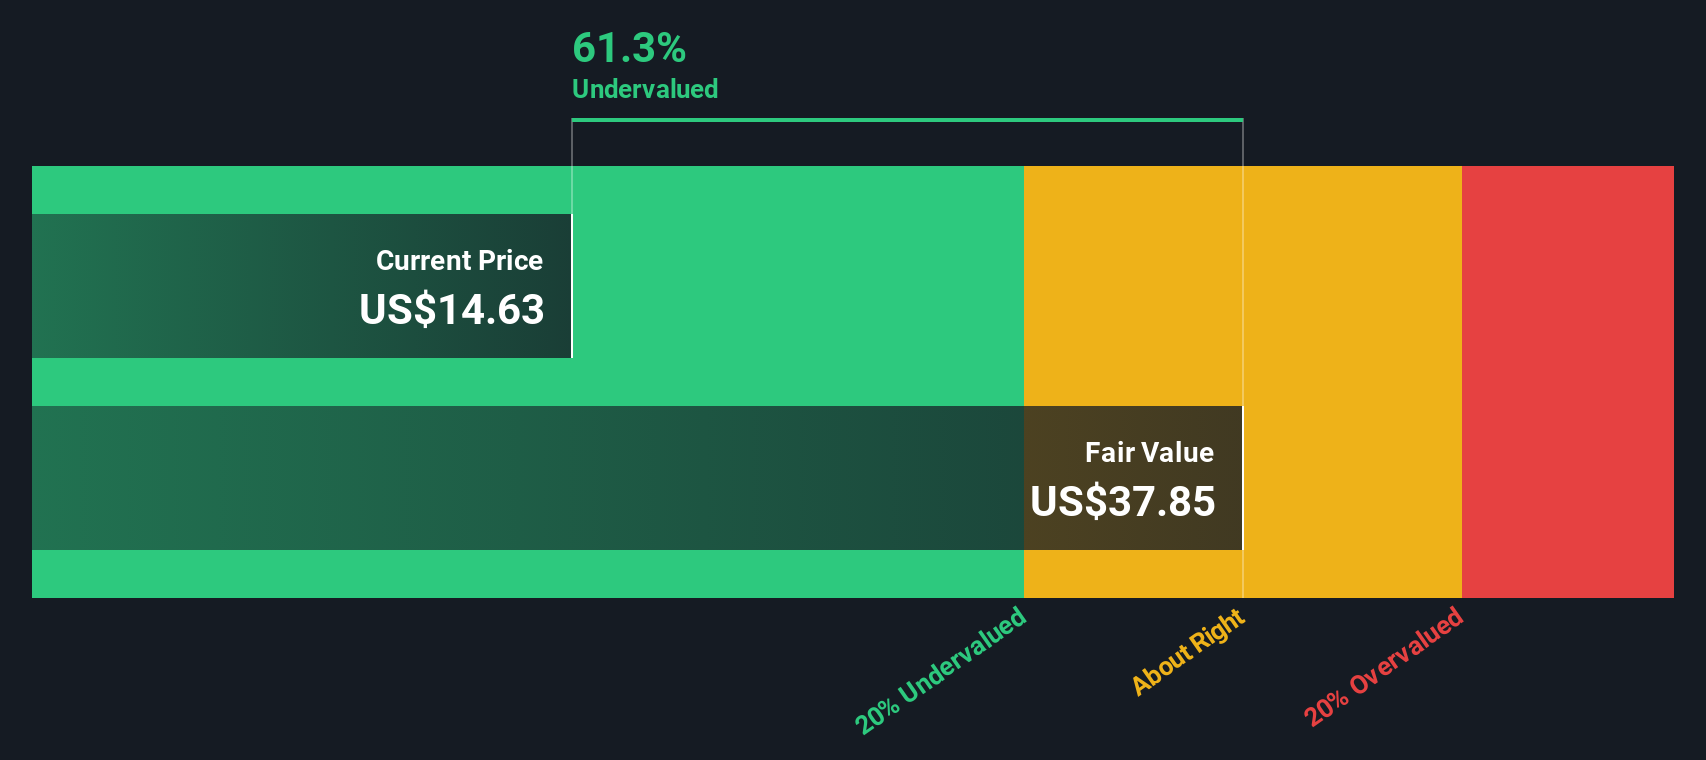
Using these projections in a two stage Free Cash Flow to Equity model produces an estimated intrinsic value of about $32.54 per share. With the stock trading near $17, the DCF output suggests it is roughly 47.7% undervalued, which indicates that the market may be heavily discounting the company’s potential for future cash generation.
Result: UNDERVALUED
Our Discounted Cash Flow (DCF) analysis suggests Bausch + Lomb is undervalued by 47.7%. Track this in your watchlist or portfolio, or discover 904 more undervalued stocks based on cash flows.
Approach 2: Bausch + Lomb Price vs Sales
For companies that are still normalizing profitability, the price to sales (P/S) ratio is often a more useful yardstick than earnings based measures, because revenue is typically more stable and less affected by temporary margin swings. In general, investors are willing to pay a higher P/S multiple for businesses with stronger growth prospects and lower perceived risk. A “normal” or “fair” P/S level should therefore reflect both how fast sales can grow and how predictable that growth is.
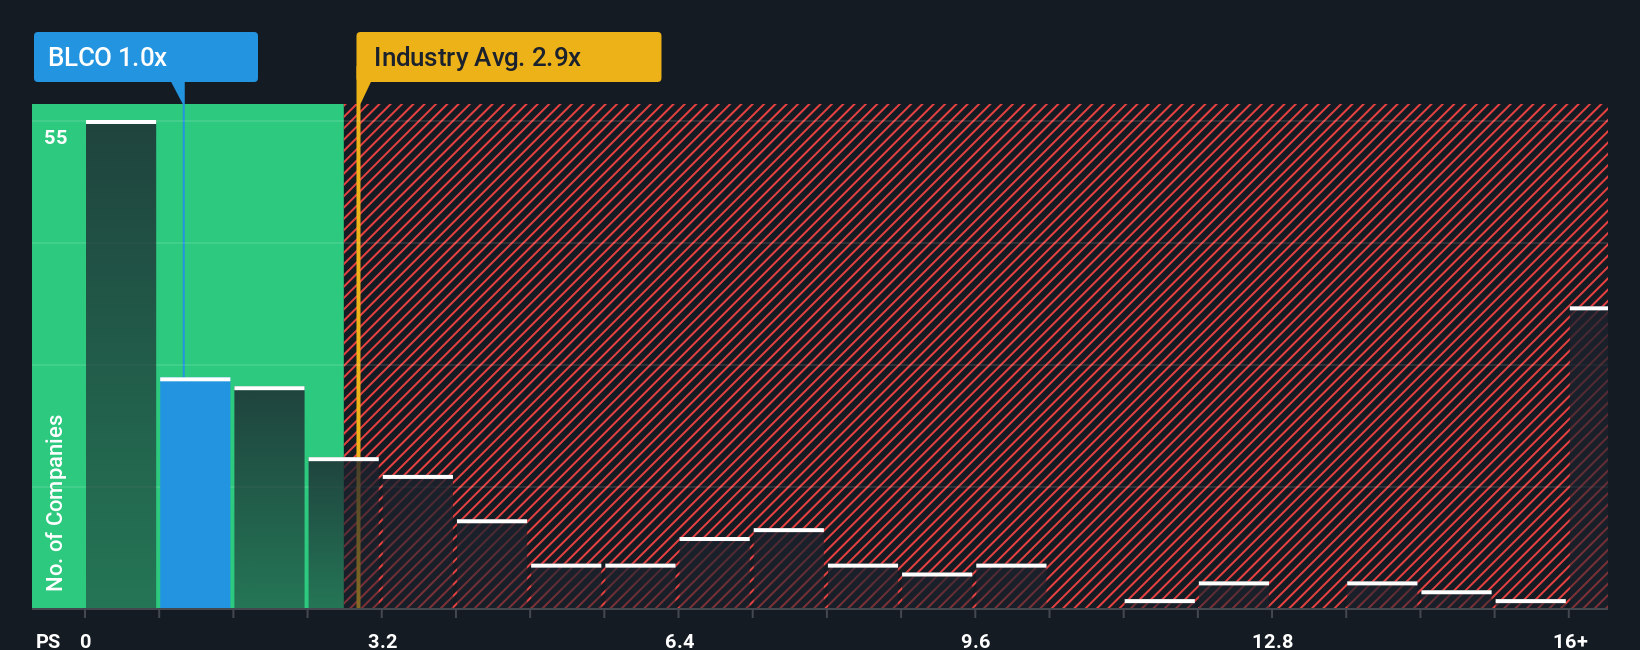
Bausch + Lomb currently trades on a P/S of about 1.21x, which is notably below the Medical Equipment industry average of around 3.04x and also below the peer average of roughly 2.70x. Simply Wall St’s proprietary Fair Ratio model estimates that, given Bausch + Lomb’s growth profile, margins, risk factors, size and industry, a more appropriate P/S would be closer to 2.44x. This Fair Ratio is more informative than a simple peer comparison because it explicitly adjusts for the company’s own fundamentals rather than assuming every business in the sector deserves the same multiple. With the actual P/S (1.21x) sitting well below the Fair Ratio (2.44x), the multiple based view points to the shares being attractively priced.
Result: UNDERVALUED
PS ratios tell one story, but what if the real opportunity lies elsewhere? Discover 1460 companies where insiders are betting big on explosive growth.
Upgrade Your Decision Making: Choose your Bausch + Lomb Narrative
Earlier we mentioned that there is an even better way to understand valuation, so let us introduce you to Narratives, a simple framework that lets you attach a clear story to your numbers by setting your own assumptions for Bausch + Lomb’s future revenue, earnings, margins and fair value. A Narrative links three things: what you believe about the business, how that belief translates into a financial forecast, and what fair value estimate falls out of that forecast. On Simply Wall St’s Community page, used by millions of investors, Narratives are an accessible tool that help you decide when to buy or sell by continuously comparing your Fair Value to the current share price and updating that view as new information, like fresh earnings or major news, comes in. For example, one Bausch + Lomb Narrative might assume rapid margin expansion and a much higher fair value, while another assumes slower growth and a lower fair value, illustrating how different but transparent stories can coexist and guide smarter decisions.
Do you think there's more to the story for Bausch + Lomb? Head over to our Community to see what others are saying!
This article by Simply Wall St is general in nature. We provide commentary based on historical data and analyst forecasts only using an unbiased methodology and our articles are not intended to be financial advice. It does not constitute a recommendation to buy or sell any stock, and does not take account of your objectives, or your financial situation. We aim to bring you long-term focused analysis driven by fundamental data. Note that our analysis may not factor in the latest price-sensitive company announcements or qualitative material. Simply Wall St has no position in any stocks mentioned.
Have feedback on this article? Concerned about the content? Get in touch with us directly. Alternatively, email editorial-team@simplywallst.com