
- LIVE QUOTES
- LEARN
- HELP
 Nasdaq
 Wall Street Journal
EN
Is Enterprise Products Partners Still Attractive After Years of Strong Unit Price Gains?
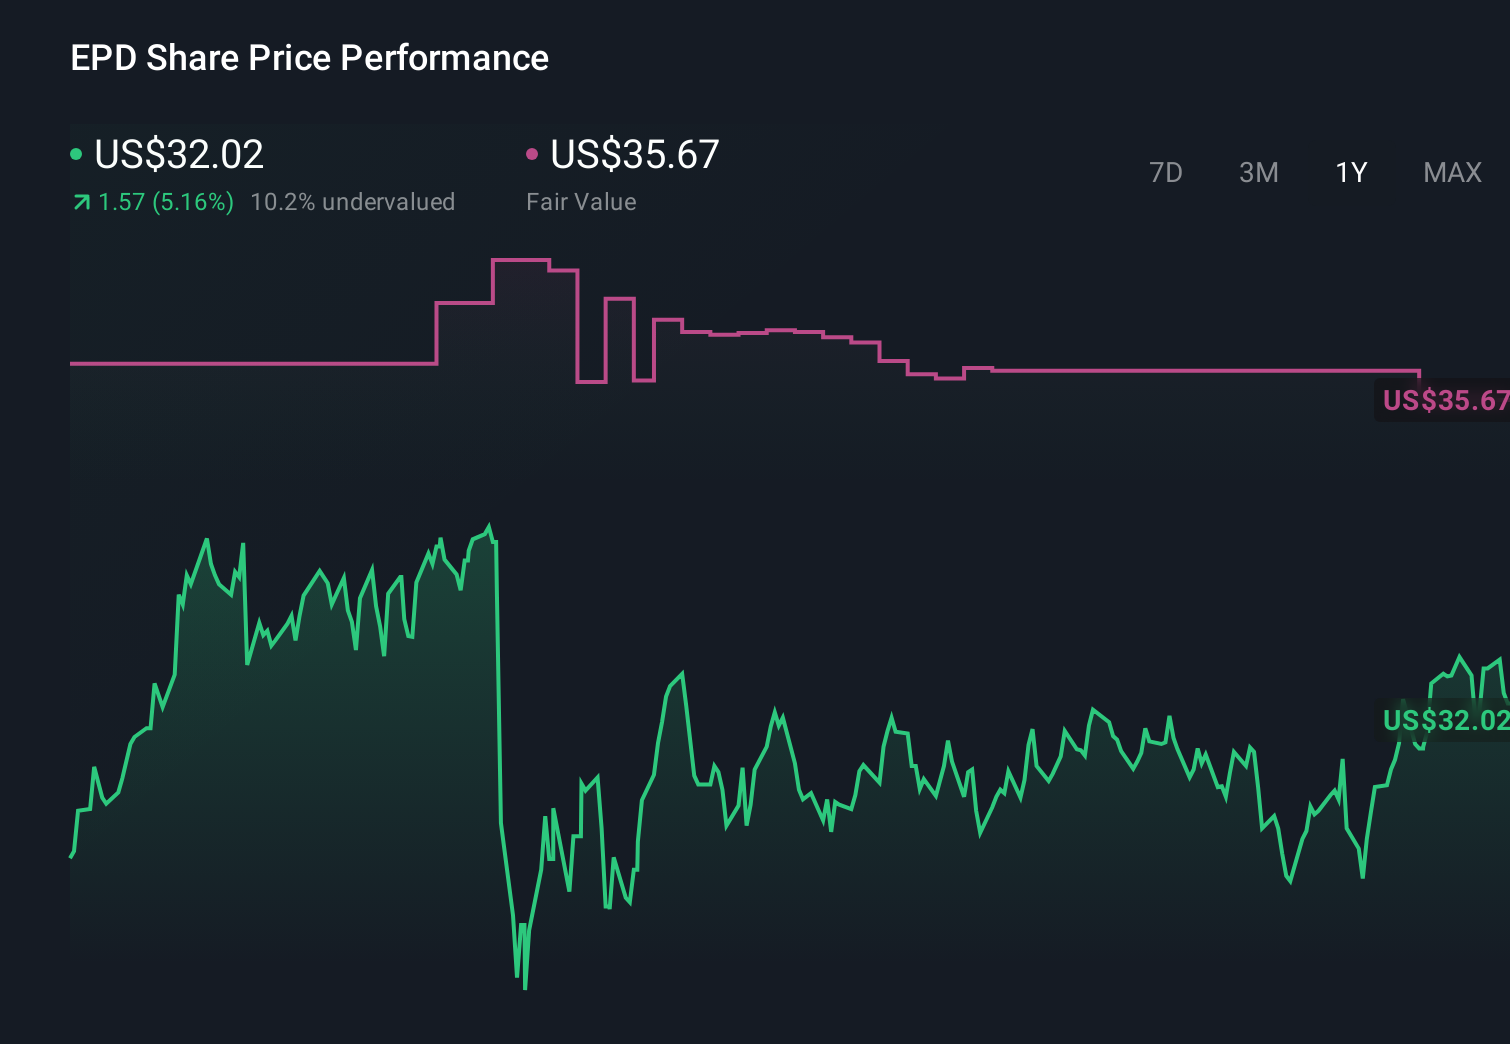
- If you are wondering whether Enterprise Products Partners is still a buy at around $32 a unit, you are not alone. Income focused investors have been debating if its current price really reflects the quality of its cash flows.
- The unit price has been fairly steady recently, up 0.2% over the last week and about 1.0% year to date, but that sits on top of longer term gains of 67.5% over three years and 137.5% over five years that have reset expectations.
- Those returns come as Enterprise continues to expand its midstream footprint, securing long term transport and storage contracts that help underpin its distribution and appeal to yield seeking investors. At the same time, the broader energy infrastructure space has been in focus as markets reassess how resilient fee based pipeline and processing businesses are in a more volatile commodity and rate environment.
- Right now, Enterprise scores a solid 5 out of 6 on our valuation checks. This suggests the market may not fully price in its cash generation and balance sheet strength. In the next sections we will unpack that score using several valuation angles before finishing with a more holistic way to think about what this business is really worth.
Approach 1: Enterprise Products Partners Discounted Cash Flow (DCF) Analysis
A Discounted Cash Flow model projects the cash Enterprise Products Partners can generate in the future and then discounts those cash flows back into today’s dollars to estimate what the business is worth now.
Enterprise currently produces around $4.16 billion in free cash flow, and analysts expect this to climb steadily as new projects come online. Simply Wall St uses analyst forecasts for the next few years and then extrapolates beyond that, with projections indicating free cash flow could reach roughly $8.53 billion by 2035. All figures are in $ and reflect cash available to equity holders.
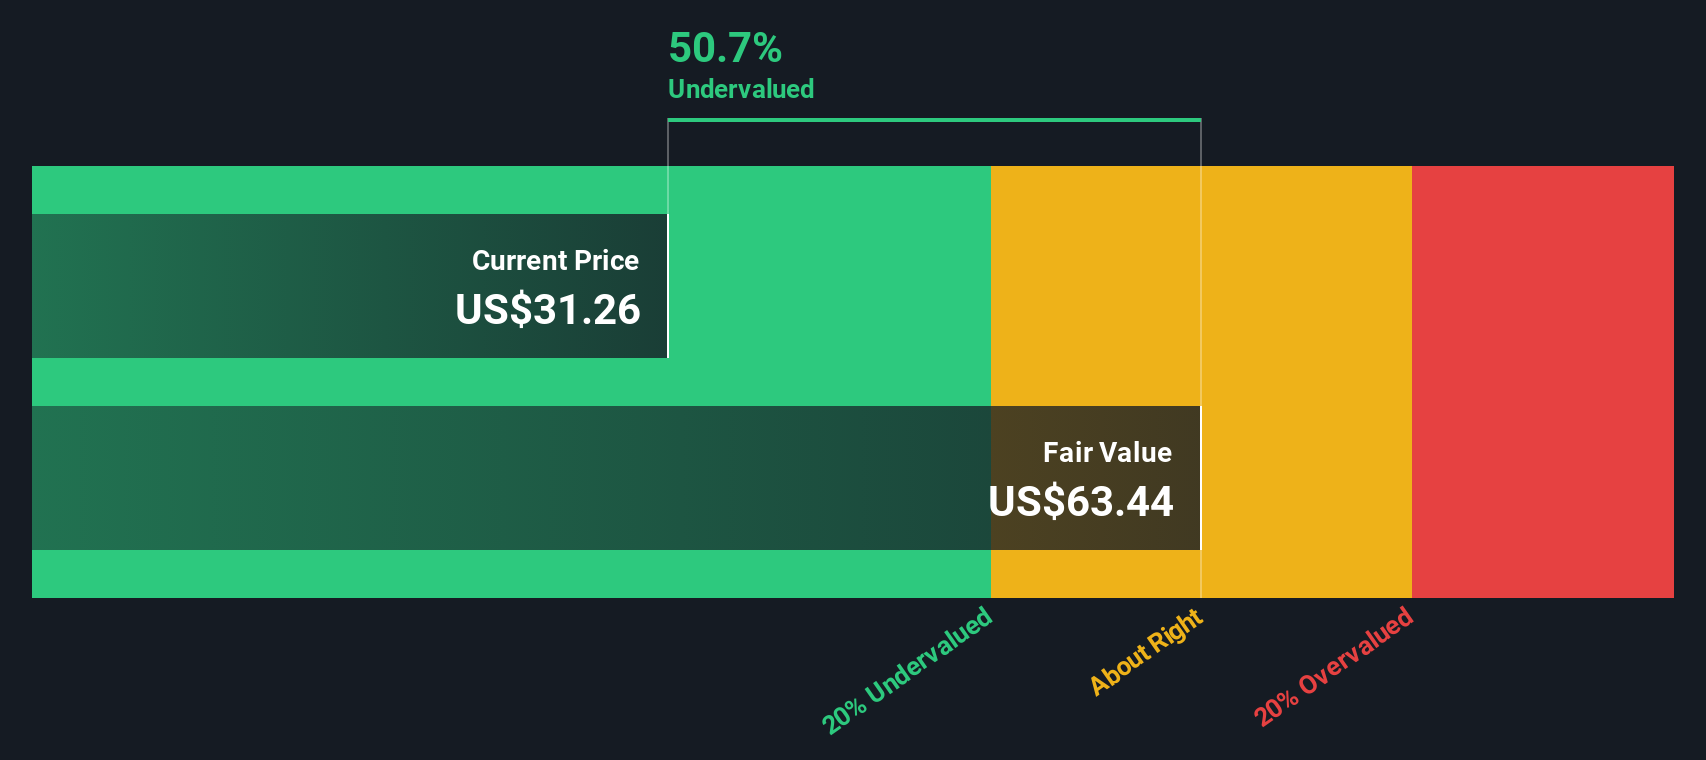
Bringing these projected cash flows back to today using a 2 Stage Free Cash Flow to Equity model yields an estimated intrinsic value of about $77.87 per unit. Compared with the current unit price near $32, the DCF indicates the units are trading at roughly a 58.8% discount to their calculated fair value. This is interpreted as a wide margin of safety for long term holders.
Result: UNDERVALUED
Our Discounted Cash Flow (DCF) analysis suggests Enterprise Products Partners is undervalued by 58.8%. Track this in your watchlist or portfolio, or discover 904 more undervalued stocks based on cash flows.
Approach 2: Enterprise Products Partners Price vs Earnings
For consistently profitable businesses like Enterprise Products Partners, the price to earnings, or PE, ratio is a useful yardstick because it links what investors pay today to the profits the business is already generating. In general, companies with stronger growth prospects and lower perceived risk can justify a higher PE, while slower growing or riskier names tend to trade on lower multiples.
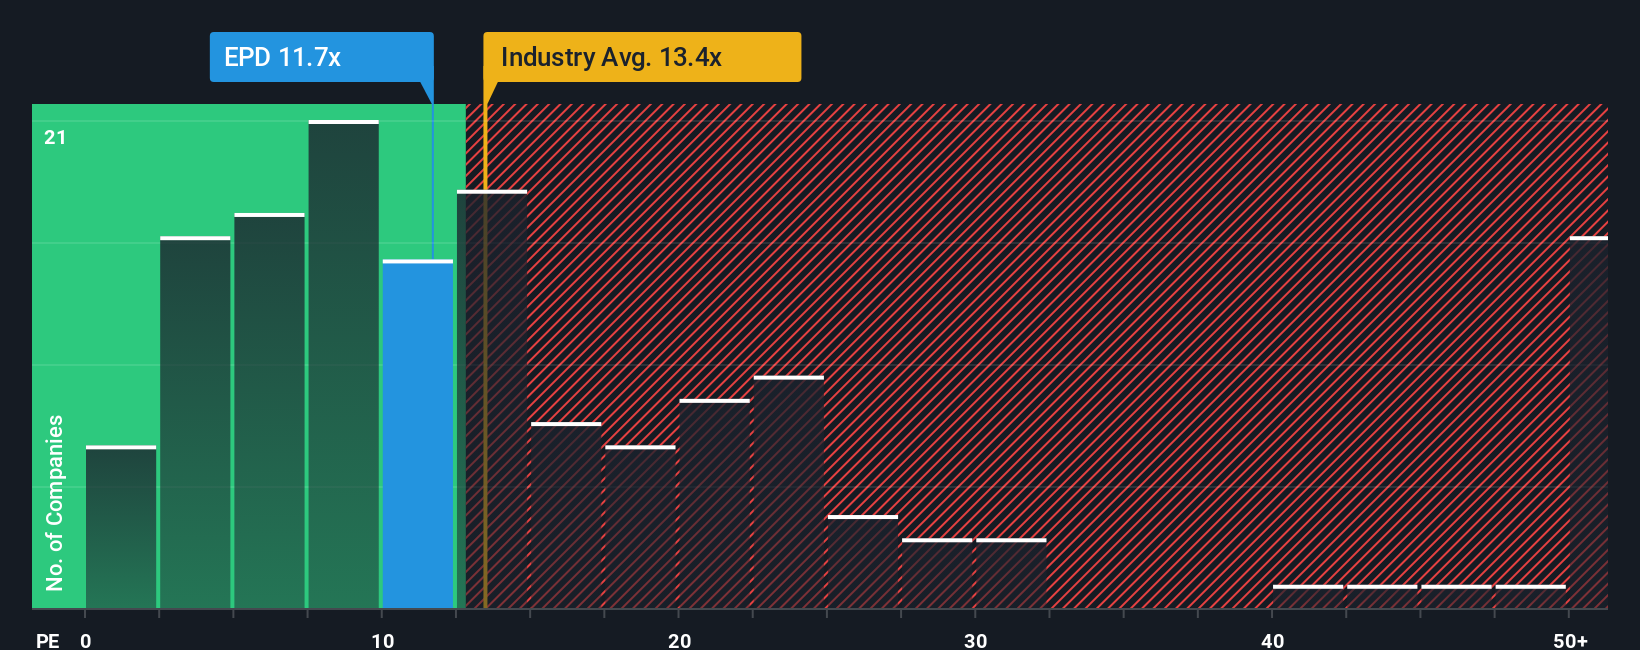
Enterprise currently trades on a PE of about 12.1x, which is slightly below the Oil and Gas industry average of roughly 12.9x and well below the broader peer group average near 19.4x. Simply Wall St also calculates a Fair Ratio of 21.1x, an estimate of the PE investors might reasonably expect given Enterprise’s earnings growth profile, margins, industry, market value and risk factors. This tailored Fair Ratio is more informative than a simple industry or peer comparison because it adjusts for Enterprise’s specific strengths and risks rather than assuming all pipeline businesses deserve the same multiple.
Comparing the current 12.1x PE to the 21.1x Fair Ratio suggests the units trade at a meaningful discount on an earnings basis.
Result: UNDERVALUED
PE ratios tell one story, but what if the real opportunity lies elsewhere? Discover 1460 companies where insiders are betting big on explosive growth.
Upgrade Your Decision Making: Choose your Enterprise Products Partners Narrative
Earlier we mentioned that there is an even better way to understand valuation, so let us introduce you to Narratives, which are simply your own story about a company, tied directly to your assumptions for its future revenue, earnings, margins and fair value. On Simply Wall St’s Community page, used by millions of investors, you can build an Enterprise Products Partners Narrative that connects what you believe about its projects, tariffs, buybacks and risks to a set of financial forecasts, and then to a clear fair value that you can compare against today’s price to inform your decision on whether to buy, hold or sell. Narratives are dynamic, updating automatically as new information like news or earnings comes in, so your fair value does not go stale when the world changes. For example, one Enterprise Products Partners Narrative on the platform might assume stronger export growth and assign a fair value near the most bullish analyst target of 40 dollars. A more cautious Narrative that focuses on commodity and leverage risks might sit closer to 32 dollars. Seeing where your own view fits between those can help you invest with intention rather than guesswork.
Do you think there's more to the story for Enterprise Products Partners? Head over to our Community to see what others are saying!
This article by Simply Wall St is general in nature. We provide commentary based on historical data and analyst forecasts only using an unbiased methodology and our articles are not intended to be financial advice. It does not constitute a recommendation to buy or sell any stock, and does not take account of your objectives, or your financial situation. We aim to bring you long-term focused analysis driven by fundamental data. Note that our analysis may not factor in the latest price-sensitive company announcements or qualitative material. Simply Wall St has no position in any stocks mentioned.
Have feedback on this article? Concerned about the content? Get in touch with us directly. Alternatively, email editorial-team@simplywallst.com