
- LIVE QUOTES
- LEARN
- HELP
 Nasdaq
 Wall Street Journal
EN
Does Boston Scientific’s Strong Run Match Its Current Valuation in 2025?
- If you have been wondering whether Boston Scientific is still a smart buy after its big run in recent years, this breakdown will help you decide if the current price actually makes sense.
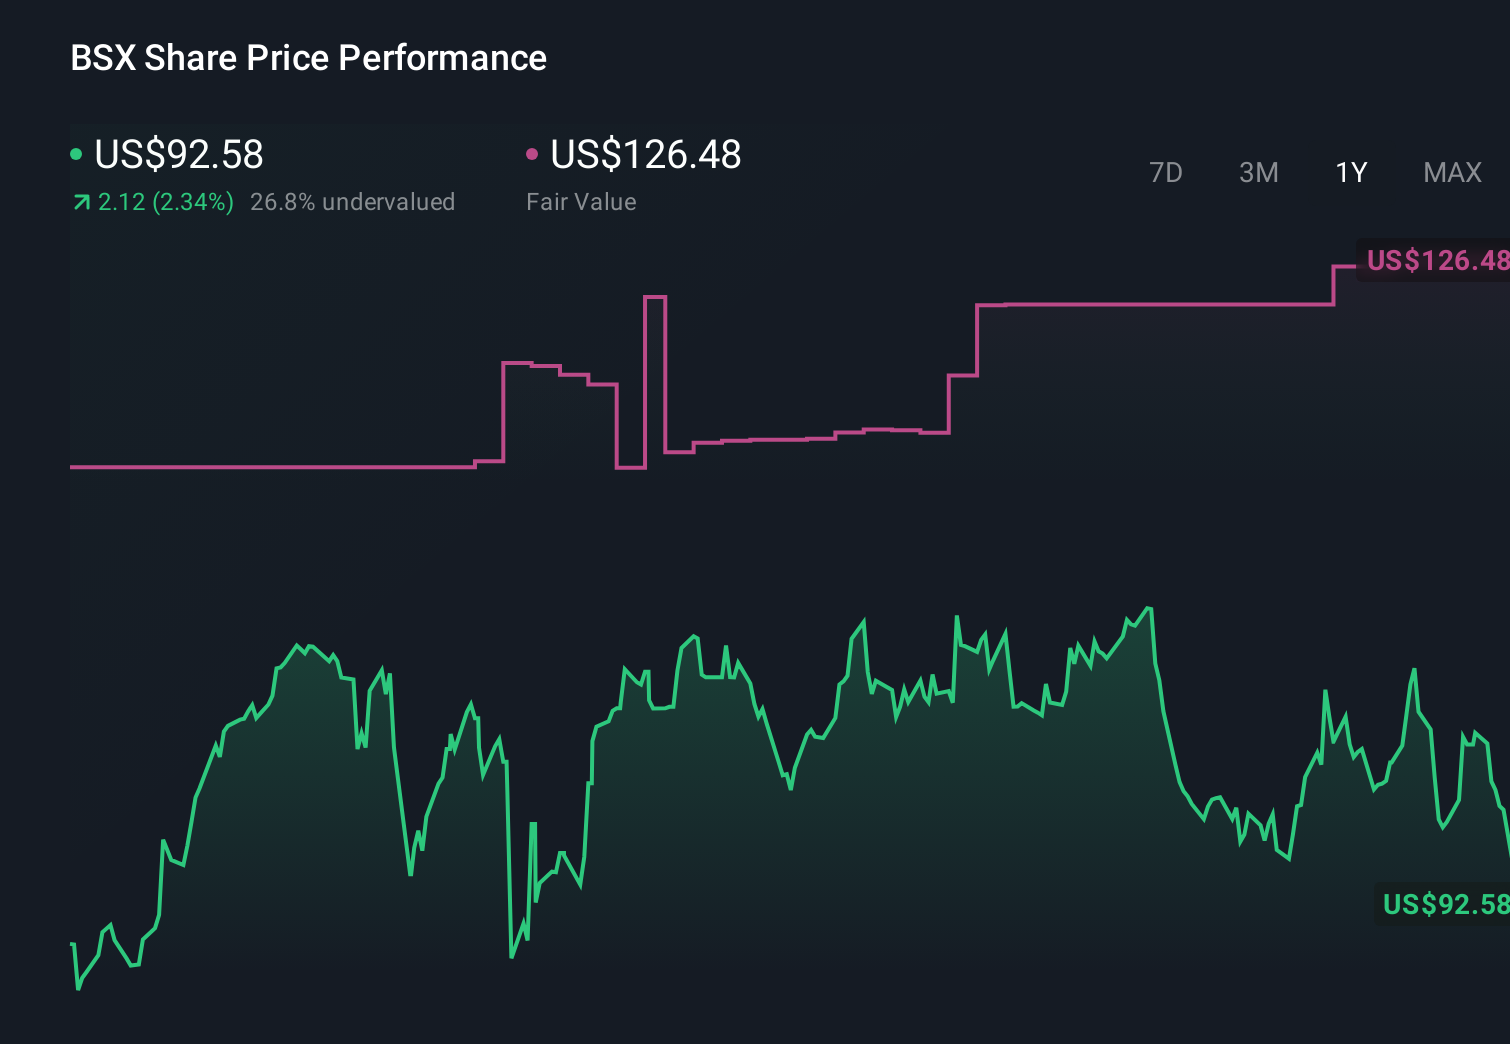
- The stock is up 110.0% over 3 years and 170.4% over 5 years, while more recently it is up 1.7% in the last week, down 1.9% over 30 days, and sitting on a 7.6% gain year to date plus a 5.6% return over the last year.
- Behind these moves, investors have been digesting continued momentum in Boston Scientific's cardiovascular and minimally invasive device portfolio, as the company doubles down on innovation in high growth therapeutic areas. In addition, ongoing regulatory and clinical trial milestones have kept expectations elevated, even as the market debates how much future growth is already priced in.
- Right now Boston Scientific only scores 1 out of 6 on our undervaluation checks. In the sections ahead we will unpack what different valuation methods say about the stock today and hint at a more powerful way to think about fair value that we will come back to at the end.
Boston Scientific scores just 1/6 on our valuation checks. See what other red flags we found in the full valuation breakdown.
Approach 1: Boston Scientific Discounted Cash Flow (DCF) Analysis
A Discounted Cash Flow model estimates what a company is worth by projecting the cash it can generate in the future and discounting those cash flows back to today in $ terms.
For Boston Scientific, the 2 Stage Free Cash Flow to Equity model starts with last twelve months free cash flow of about $3.8 billion. Analysts provide explicit forecasts for the next few years, including free cash flow of roughly $4.5 billion by 2027. Beyond that, Simply Wall St extrapolates growth, with projections reaching around $6.4 billion of free cash flow by 2035, as the cardiovascular and minimally invasive portfolio continues to scale.
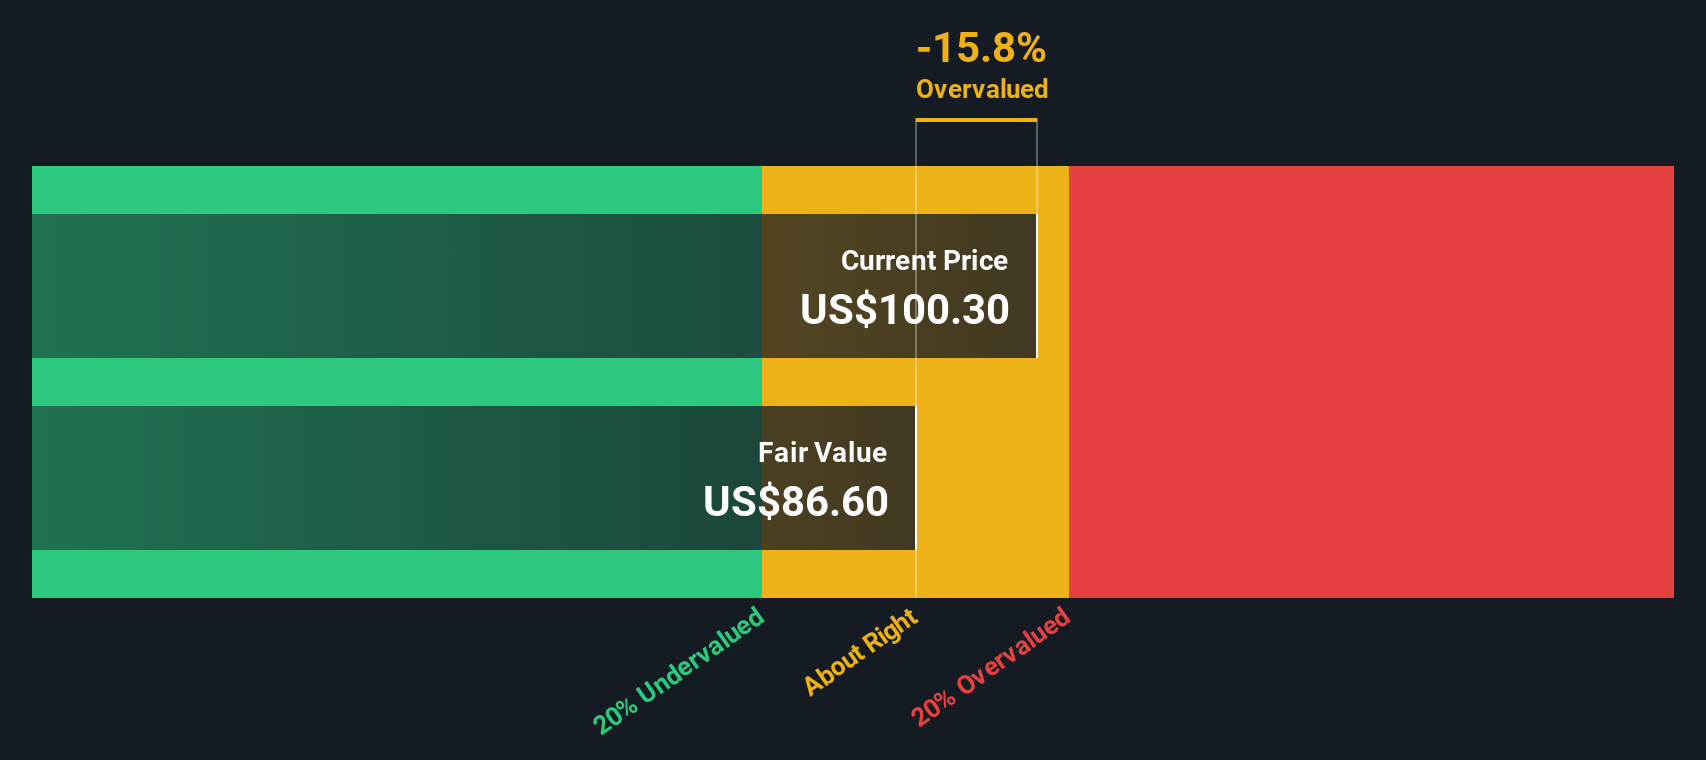
When all these future cash flows are discounted back, the model arrives at an intrinsic value of about $68.41 per share. Given the implied 40.5% overvaluation from this DCF, the market price currently sits well above what these cash flow projections support, which suggests expectations are aggressive rather than conservative.
Result: OVERVALUED
Our Discounted Cash Flow (DCF) analysis suggests Boston Scientific may be overvalued by 40.5%. Discover 904 undervalued stocks or create your own screener to find better value opportunities.
Approach 2: Boston Scientific Price vs Earnings
For a profitable business like Boston Scientific, the price to earnings ratio is a practical way to gauge how much investors are willing to pay today for each dollar of current earnings. Companies with faster, more reliable earnings growth and lower perceived risk can usually justify a higher normal PE range, while slower or more uncertain growers tend to trade on lower multiples.
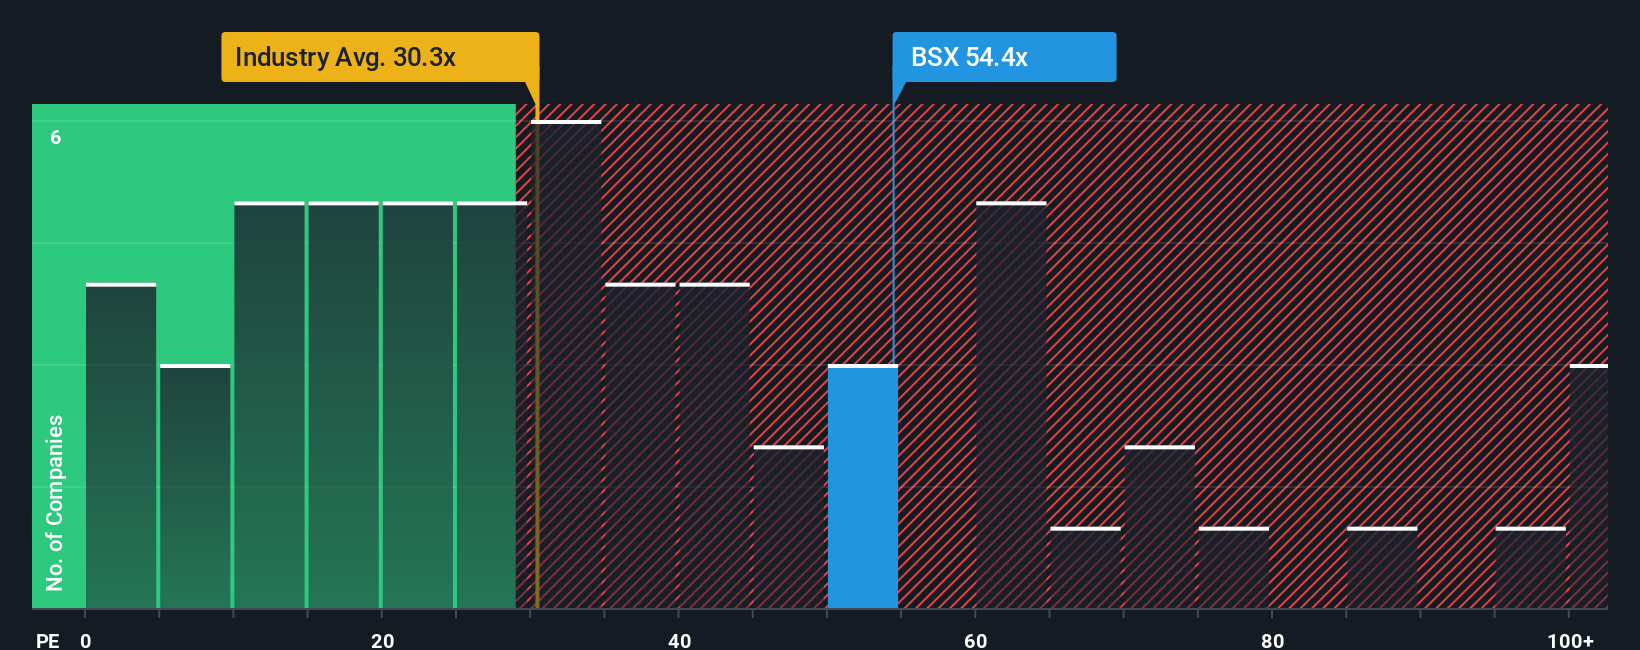
Boston Scientific currently trades on a PE of about 51.1x, which is well above both the Medical Equipment industry average of roughly 29.6x and the broader peer group average of around 40.6x. Simply Wall St also calculates a Fair Ratio of 38.3x, a proprietary view of what a reasonable PE should be given Boston Scientific's earnings growth profile, profit margins, industry positioning, market cap and risk factors.
This Fair Ratio framework is more informative than a simple comparison with peers or the sector, because it blends company specific fundamentals with the competitive and market context rather than assuming all medical device makers deserve the same multiple. Comparing the Fair Ratio of 38.3x to the current 51.1x suggests Boston Scientific is trading at a premium that looks rich relative to its fundamentals.
Result: OVERVALUED
PE ratios tell one story, but what if the real opportunity lies elsewhere? Discover 1460 companies where insiders are betting big on explosive growth.
Upgrade Your Decision Making: Choose your Boston Scientific Narrative
Earlier we mentioned that there is an even better way to understand valuation, so let us introduce you to Narratives, a simple way to attach your own story about Boston Scientific to the numbers by linking your assumptions for future revenue, earnings and margins to a forecast and then to a clear view of fair value. Narratives on Simply Wall St’s Community page are designed to be accessible, so you can select or adjust a storyline that fits your view of the business and instantly see how that translates into a fair value you can compare with today’s share price to decide whether BSX looks like a buy, hold or sell. As new information such as earnings, guidance or major news emerges, these Narratives update dynamically, ensuring that your story, forecast and valuation stay aligned with reality. For example, one investor might build a Boston Scientific Narrative that supports a fair value in the high $130s based on sustained double digit growth and rising margins, while another might use more cautious assumptions and land closer to $100, and Narratives helps you see exactly which expectations would need to be true for each view to make sense.
Do you think there's more to the story for Boston Scientific? Head over to our Community to see what others are saying!
This article by Simply Wall St is general in nature. We provide commentary based on historical data and analyst forecasts only using an unbiased methodology and our articles are not intended to be financial advice. It does not constitute a recommendation to buy or sell any stock, and does not take account of your objectives, or your financial situation. We aim to bring you long-term focused analysis driven by fundamental data. Note that our analysis may not factor in the latest price-sensitive company announcements or qualitative material. Simply Wall St has no position in any stocks mentioned.
Have feedback on this article? Concerned about the content? Get in touch with us directly. Alternatively, email editorial-team@simplywallst.com