
- LIVE QUOTES
- LEARN
- HELP
 Nasdaq
 Wall Street Journal
EN
Lululemon (LULU): Reassessing Valuation After a 24% One-Month Share Price Rebound
lululemon athletica (LULU) has been on a sharp rebound recently, with the stock climbing about 24% over the past month and 22% in the past 3 months after a tough year.
See our latest analysis for lululemon athletica.
That sharp rebound stands in contrast to a tough stretch, with the share price still well below its early year levels despite the recent 1 month share price return of roughly 24 percent. This suggests sentiment may be stabilizing rather than fully turning.
If lululemon’s move has you rethinking growth stories in retail, it could be a good moment to explore fast growing stocks with high insider ownership as potential next candidates for your watchlist.
With shares still down sharply over the past year despite a recent rebound and modest revenue growth, the key question now is whether lululemon is trading below its true potential or if the market already reflects its next leg of growth.
Most Popular Narrative Narrative: 10.6% Overvalued
With lululemon’s last close at $210.40 versus a narrative fair value near $190, the current setup frames a premium that hinges on execution.
The analysts have a consensus price target of $206.168 for lululemon athletica based on their expectations of its future earnings growth, profit margins and other risk factors. However, there is a degree of disagreement amongst analysts, with the most bullish reporting a price target of $303.0, and the most bearish reporting a price target of just $100.0.
Want to see how modest top line growth, easing margins, and a future earnings multiple still argue for upside from here? The narrative’s math may surprise you.
Result: Fair Value of $190.19 (OVERVALUED)
Have a read of the narrative in full and understand what's behind the forecasts.
However, stubborn U.S. weakness and intensifying competition could force deeper discounting, squeezing margins and upending assumptions that modest growth still justifies today’s premium.
Find out about the key risks to this lululemon athletica narrative.
Another View: Market Ratio Signals
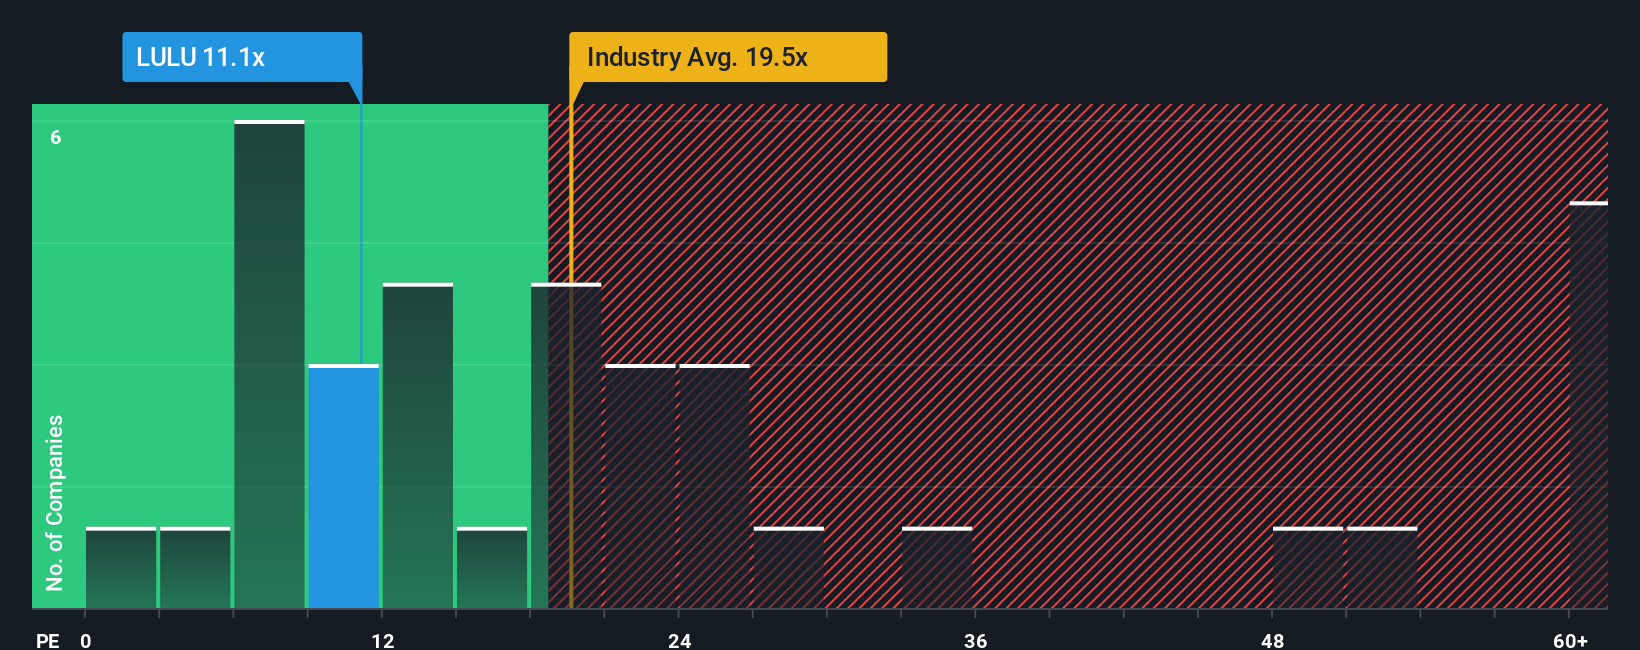
While the narrative fair value suggests lululemon is about 10.6 percent overvalued, its current price to earnings ratio of roughly 14.2 times paints a softer picture. That figure sits well below peers at 51.8 times and under a fair ratio near 17.4 times, hinting the market may already price in a lot of caution. Which signal do you trust more: sentiment or the spreadsheet.
See what the numbers say about this price — find out in our valuation breakdown.
Build Your Own lululemon athletica Narrative
If you see the numbers differently or want to dive into the data yourself, you can build a fresh narrative in just minutes, Do it your way.
A great starting point for your lululemon athletica research is our analysis highlighting 3 key rewards and 2 important warning signs that could impact your investment decision.
Looking for more investment ideas?
Before the next market swing catches you off guard, use the Simply Wall St Screener to build a pipeline of differentiated ideas beyond lululemon.
- Capture underpriced potential by scanning these 904 undervalued stocks based on cash flows that strong cash flow analysis suggests the market is still sleeping on.
- Explore structural shifts in healthcare by targeting these 29 healthcare AI stocks that aim to push AI deeper into diagnostics, treatment planning, and operational efficiency.
- Follow developments in digital payments with these 80 cryptocurrency and blockchain stocks focusing on companies working to translate blockchain innovation into real revenue momentum.
This article by Simply Wall St is general in nature. We provide commentary based on historical data and analyst forecasts only using an unbiased methodology and our articles are not intended to be financial advice. It does not constitute a recommendation to buy or sell any stock, and does not take account of your objectives, or your financial situation. We aim to bring you long-term focused analysis driven by fundamental data. Note that our analysis may not factor in the latest price-sensitive company announcements or qualitative material. Simply Wall St has no position in any stocks mentioned.
Have feedback on this article? Concerned about the content? Get in touch with us directly. Alternatively, email editorial-team@simplywallst.com