
- LIVE QUOTES
- LEARN
- HELP
 Nasdaq
 Wall Street Journal
EN
Does Cenovus Still Offer Upside After Recent Pullback And Strong Five Year Run?
- Wondering if Cenovus Energy is still a smart buy at today’s price, or if most of the upside is already baked in? This article unpacks what the market is really paying for this stock.
- Despite a solid 12.4% gain over the last year and a 228.4% return over five years, the share price has cooled recently, down 2.3% over the past week and 9.2% over the last month, while remaining up 3.8% year to date.
- That pullback comes as investors digest a mix of macro and company specific developments, including shifting oil price expectations, ongoing capital allocation decisions, and continued integration of past acquisitions that reshaped Cenovus into a much larger integrated energy player. Together, these drivers are nudging sentiment back and forth between cautious and optimistic. This is exactly when valuation tends to matter most.
- Right now, Cenovus scores a 6/6 valuation check score, suggesting it screens as undervalued across all the tests used in that framework. The key question is how robust that conclusion is under different valuation approaches, and whether there is an even better way to think about value that we will explore by the end of this article.
Find out why Cenovus Energy's 12.4% return over the last year is lagging behind its peers.
Approach 1: Cenovus Energy Discounted Cash Flow (DCF) Analysis
A Discounted Cash Flow model estimates what a company is worth today by projecting the cash it can generate in the future and discounting those cash flows back to the present.
For Cenovus Energy, the latest twelve month Free Cash Flow is about CA$3.27 billion. Analysts provide detailed forecasts for the next few years, and these are then extended by Simply Wall St to build a longer term view. On this basis, Cenovus’s Free Cash Flow is projected to rise to roughly CA$6.39 billion by 2035, reflecting steady growth as the business scales and matures.
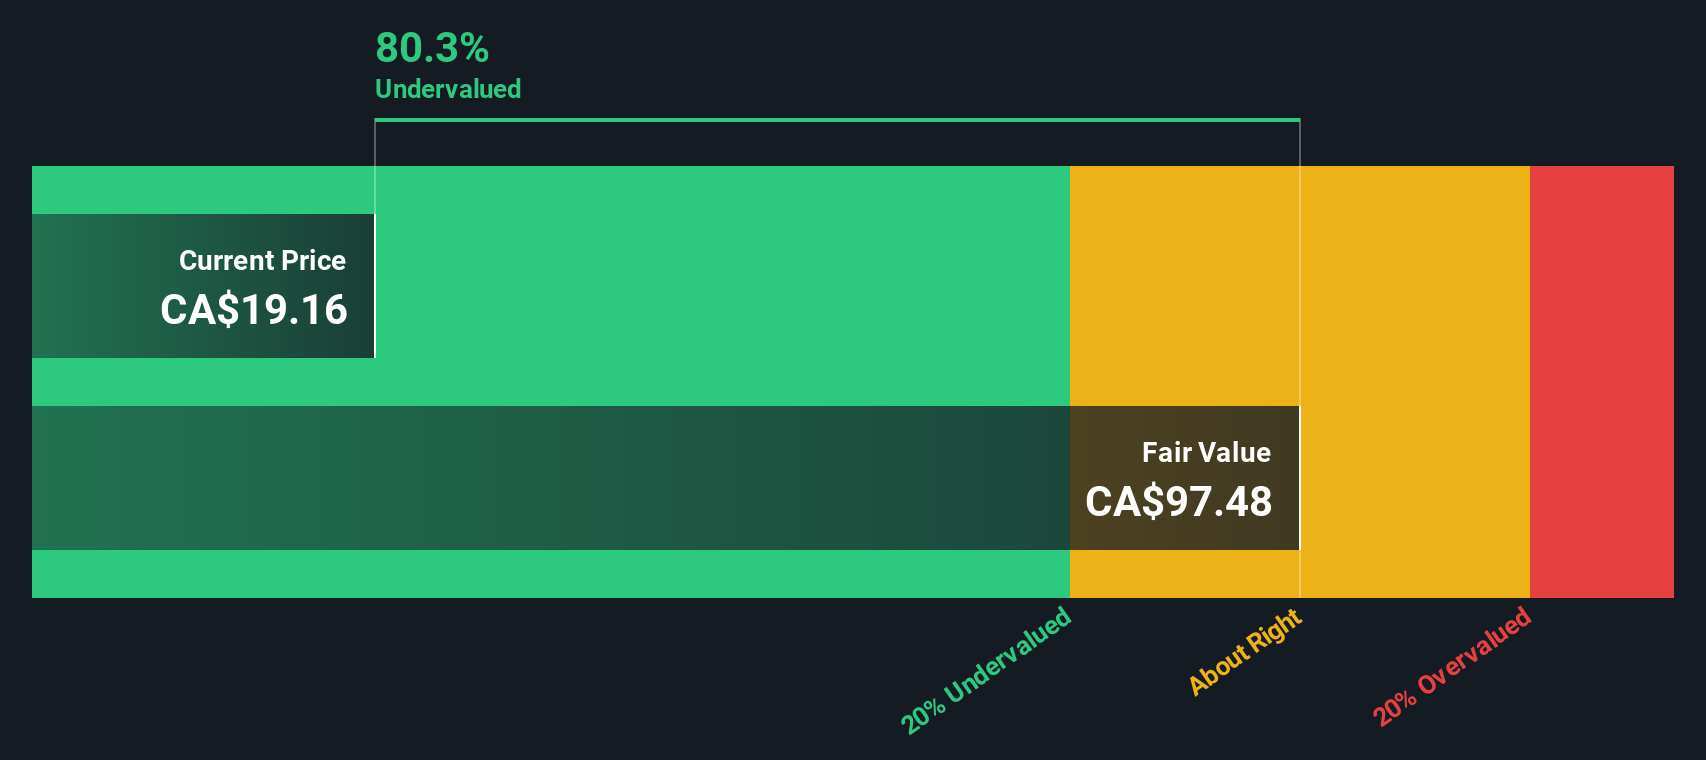
Those future CA$ cash flows are discounted using a 2 Stage Free Cash Flow to Equity model. This is used to arrive at an estimated intrinsic value of CA$77.63 per share. Compared with the current share price, this framework implies the stock trades at a 70.5% discount to its DCF value. This suggests investors are paying far less than the modelled worth of the underlying cash generation.
Result: UNDERVALUED
Our Discounted Cash Flow (DCF) analysis suggests Cenovus Energy is undervalued by 70.5%. Track this in your watchlist or portfolio, or discover 904 more undervalued stocks based on cash flows.
Approach 2: Cenovus Energy Price vs Earnings
For a consistently profitable business like Cenovus, the Price to Earnings (PE) ratio is a practical way to judge what investors are paying for each dollar of earnings. In general, faster growth and lower perceived risk can justify a higher PE, while slower growth or higher risk usually call for a lower, more conservative multiple.
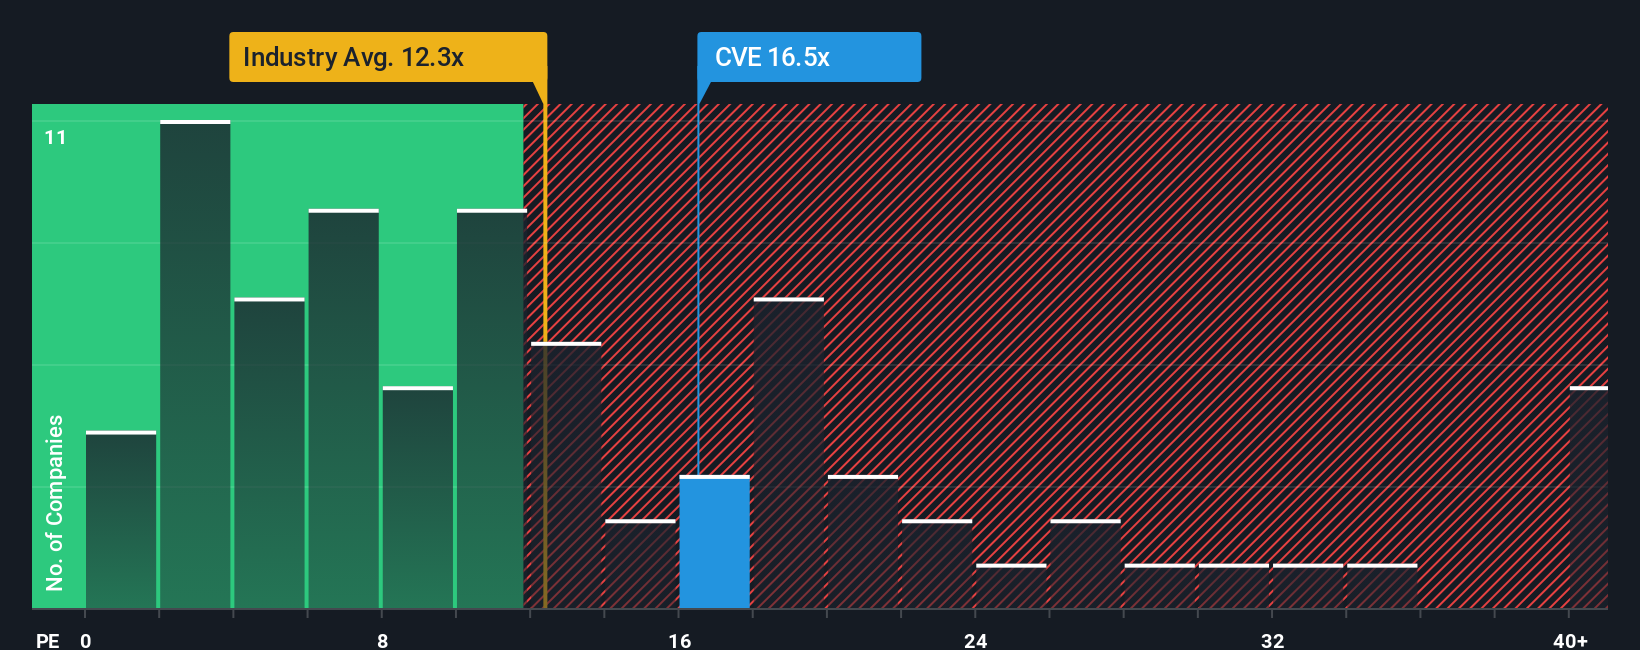
Cenovus currently trades at about 13.83x earnings, which is slightly below the broader Oil and Gas industry average of around 14.07x and meaningfully below the peer group average of roughly 16.76x. On the surface, that suggests the market is valuing Cenovus at a discount to many comparable names.
Simply Wall St also calculates a Fair Ratio, its proprietary estimate of what a normal PE should be for this business given its earnings growth outlook, margins, industry, market value and risk profile. For Cenovus, that Fair Ratio comes out at 17.33x, which is more tailored than a simple peer or industry comparison because it directly links valuation to the company’s own fundamentals. With the actual PE of 13.83x sitting well below this 17.33x Fair Ratio, the multiple based view points to meaningful undervaluation.
Result: UNDERVALUED
PE ratios tell one story, but what if the real opportunity lies elsewhere? Discover 1460 companies where insiders are betting big on explosive growth.
Upgrade Your Decision Making: Choose your Cenovus Energy Narrative
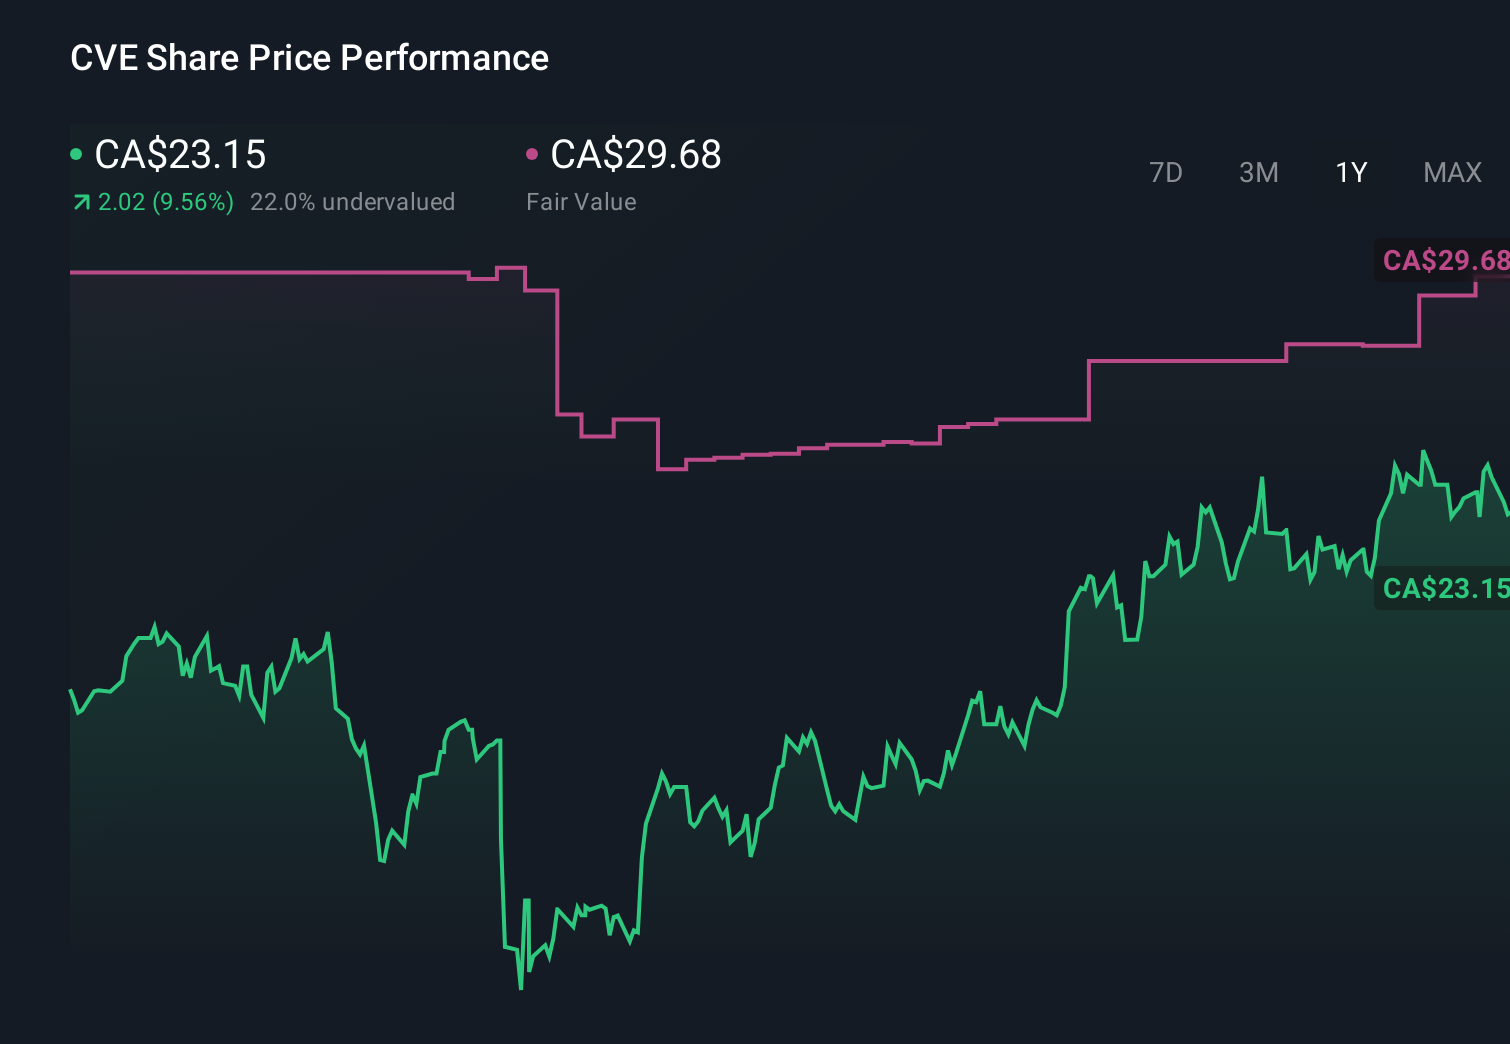
Earlier we mentioned that there is an even better way to understand valuation. So let's introduce you to Narratives, a simple way to connect your view of Cenovus’s story with the numbers. You can tie your assumptions for future revenue, earnings, and margins to a financial forecast that produces a Fair Value you can compare with today’s share price to decide whether to buy, hold, or sell. All of this is available within an easy to use tool on Simply Wall St’s Community page that millions of investors already use. Narratives automatically update as new news or earnings arrive so your thesis stays current. You can see, for example, one Cenovus Narrative that assumes successful MEG integration, stronger cash flows, and a Fair Value near CA$29.68 alongside a more cautious Narrative that focuses on regulatory, energy transition, and integration risks with a Fair Value closer to CA$21. This helps you quickly understand how different perspectives and assumptions translate into different valuations and risk reward trade offs.
Do you think there's more to the story for Cenovus Energy? Head over to our Community to see what others are saying!
This article by Simply Wall St is general in nature. We provide commentary based on historical data and analyst forecasts only using an unbiased methodology and our articles are not intended to be financial advice. It does not constitute a recommendation to buy or sell any stock, and does not take account of your objectives, or your financial situation. We aim to bring you long-term focused analysis driven by fundamental data. Note that our analysis may not factor in the latest price-sensitive company announcements or qualitative material. Simply Wall St has no position in any stocks mentioned.
Have feedback on this article? Concerned about the content? Get in touch with us directly. Alternatively, email editorial-team@simplywallst.com