
- LIVE QUOTES
- LEARN
- HELP
 Nasdaq
 Wall Street Journal
EN
Has Coca‑Cola’s Zero Sugar Expansion Left Further Upside For The Stock In 2025?
- If you are wondering whether Coca-Cola is still attractive at around $70 a share, or if the easy money has already been made, you are not alone. That is exactly what we are going to unpack here.
- Despite a recent pullback of 0.8% over the last week and 3.4% over the past month, the stock is still up 13.4% year to date and nearly 50% over five years, which indicates that long term holders have been rewarded.
- Recent headlines have focused on Coca-Cola expanding its zero sugar lineup and deepening partnerships with fast food chains. These moves support its pricing power and global brand reach. At the same time, investors have been weighing macro concerns such as consumer spending trends and interest rates, which helps explain why the shares have cooled off a bit in the short term.
- In our checks Coca-Cola scores a 3/6 valuation score. This suggests it appears undervalued on some metrics but not especially cheap on others. That makes how you value it particularly important and sets us up to walk through different valuation approaches before finishing with a more powerful way to think about its worth.
Approach 1: Coca-Cola Discounted Cash Flow (DCF) Analysis
A Discounted Cash Flow model estimates what a business is worth by projecting the cash it can generate in the future and then discounting those cash flows back to today in dollar terms.
For Coca-Cola, the latest twelve month free cash flow is about $5.6 billion. Using a 2 Stage Free Cash Flow to Equity model, analysts and extrapolations from Simply Wall St project free cash flow rising to roughly $19.4 billion by 2035, with the 2029 estimate at $15.2 billion. In other words, the model assumes steady long term growth in the cash Coca-Cola returns to shareholders.
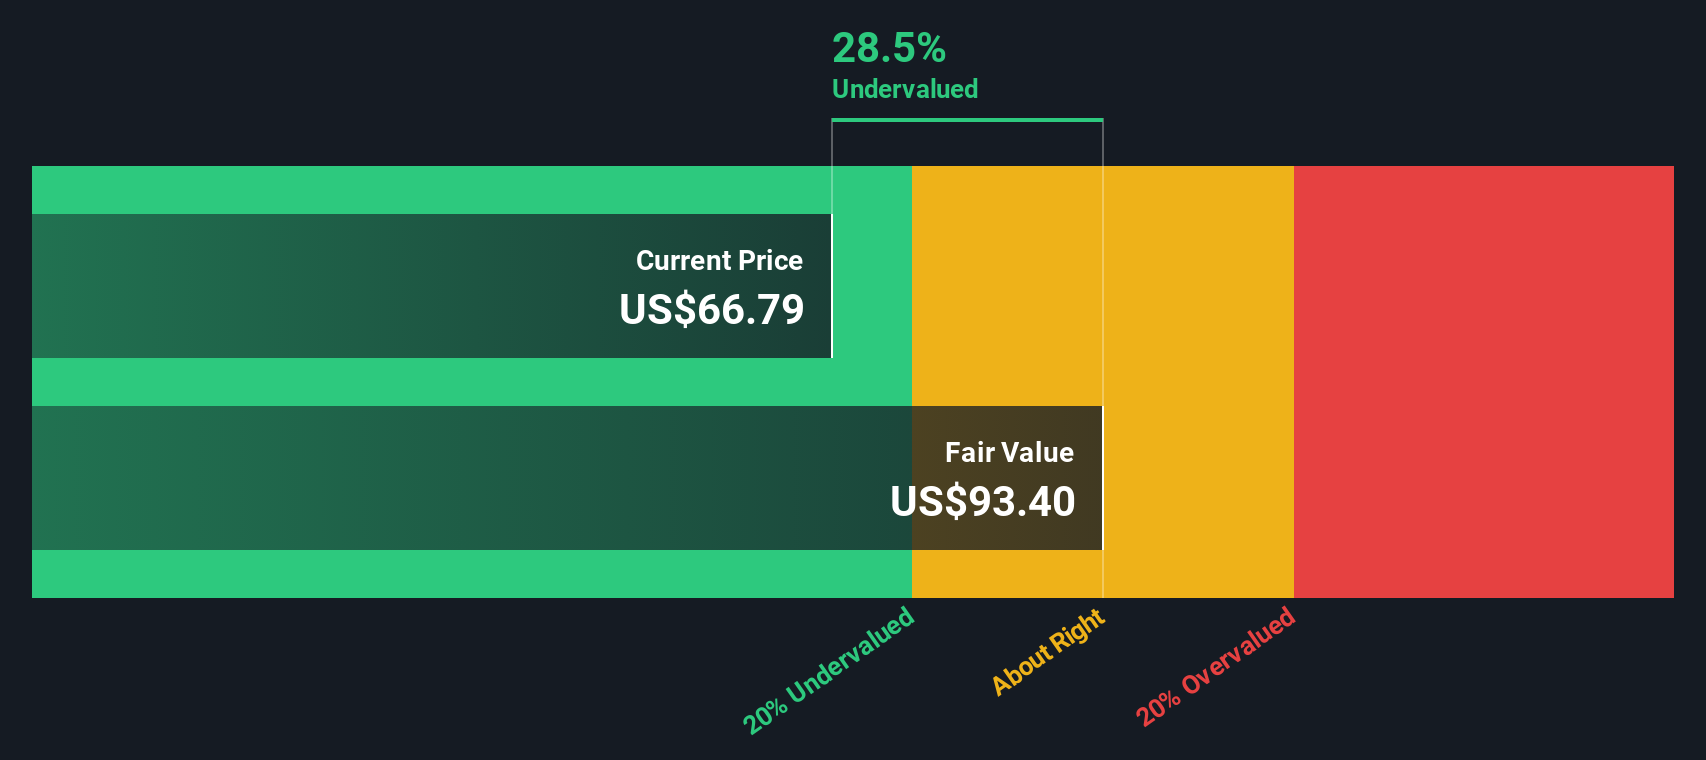
When those future cash flows are discounted back to today, the DCF model arrives at an intrinsic value of about $89.90 per share. Compared with a recent share price around $70, the model implies the stock is roughly 22.0% undervalued, which indicates a margin of safety if the cash flow assumptions prove accurate.
Result: UNDERVALUED
Our Discounted Cash Flow (DCF) analysis suggests Coca-Cola is undervalued by 22.0%. Track this in your watchlist or portfolio, or discover 905 more undervalued stocks based on cash flows.
Approach 2: Coca-Cola Price vs Earnings
For a mature, consistently profitable business like Coca-Cola, the price to earnings, or PE, ratio is a useful way to gauge whether investors are paying a reasonable price for each dollar of profit. In general, faster expected earnings growth and lower perceived risk justify a higher PE, while slower growth or higher risk argue for a lower, more conservative multiple.
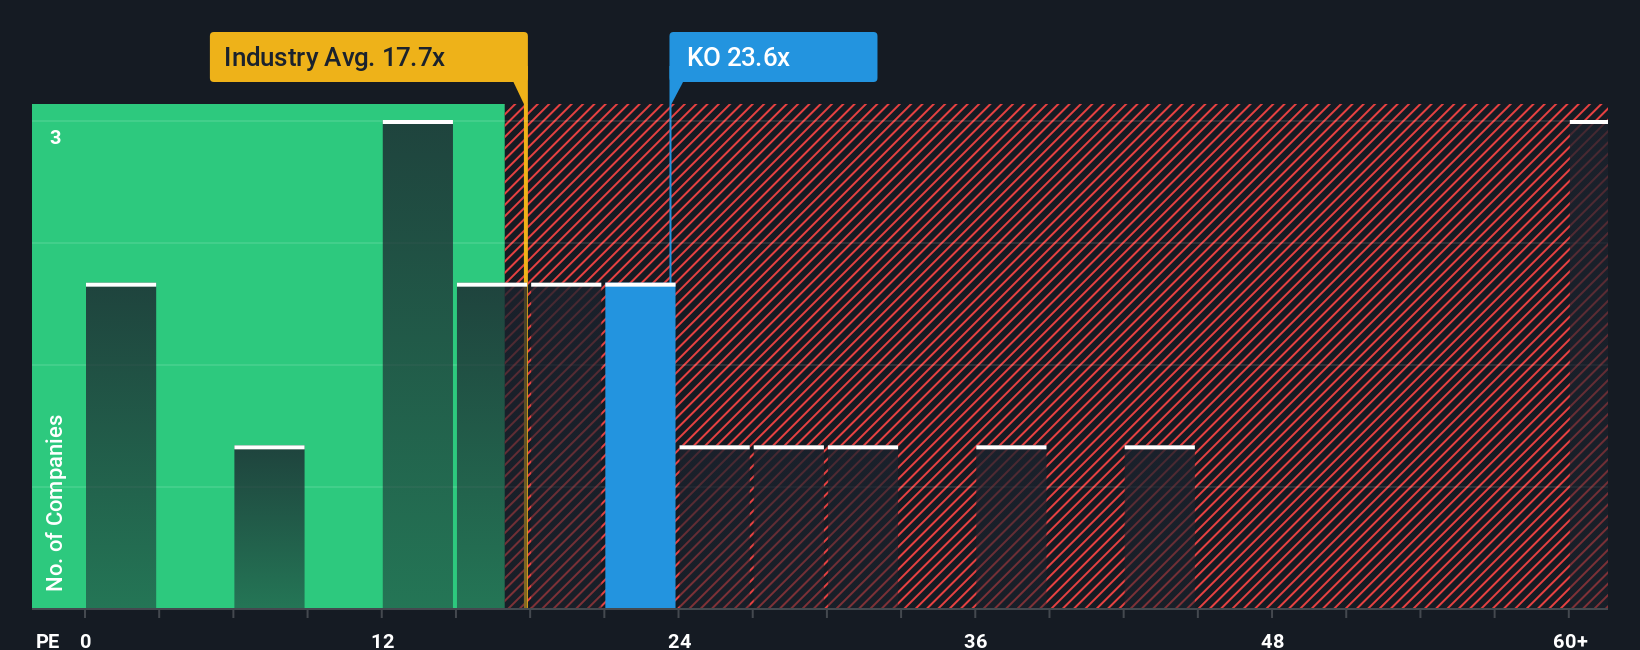
Coca-Cola currently trades at about 23.14x earnings, which is above the broader Beverage industry average of around 17.55x but below the average of its closer peers at roughly 27.66x. Simply Wall St goes a step further by estimating a Fair Ratio of 23.05x, a proprietary view of what Coca-Cola’s PE should be once factors such as earnings growth, profit margins, industry, market cap and company specific risks are all considered together. This tends to be more informative than a simple comparison with peers or the sector, which may differ meaningfully in quality or risk.
With Coca-Cola’s actual PE of 23.14x sitting very close to the Fair Ratio of 23.05x, the multiple based valuation suggests the stock is trading around its intrinsic worth.
Result: ABOUT RIGHT
PE ratios tell one story, but what if the real opportunity lies elsewhere? Discover 1459 companies where insiders are betting big on explosive growth.
Upgrade Your Decision Making: Choose your Coca-Cola Narrative
Earlier we mentioned that there is an even better way to understand valuation, so let us introduce you to Narratives, a simple way to connect your view of Coca-Cola’s story with concrete forecasts for its future revenue, earnings, margins and ultimately its fair value.
A Narrative is your version of the company’s story translated into numbers, where you spell out what you think will drive Coca-Cola’s business over time and how that should flow through to a financial model rather than relying only on backward looking ratios.
On Simply Wall St, Narratives are an easy to use tool available on the Community page, where millions of investors already combine their qualitative views with assumptions to generate a fair value estimate and then compare that to the current share price to decide whether to buy, hold or sell.
Because Narratives update dynamically when new information such as earnings, guidance or major news is released, your fair value view evolves with the story. One investor might see Coca-Cola as modestly undervalued at around $67.50 per share, while another views it as fairly valued near $71, and both perspectives can coexist transparently within the platform.
For Coca-Cola however we will make it really easy for you with previews of two leading Coca-Cola Narratives:
Fair value: $71.00 per share
Implied undervaluation vs last close: -1.25%
Forecast revenue growth: 6.64%
- Views Coca-Cola as a resilient, recession tested global brand with a vast distribution network and economies of scale that support stable cash flows.
- Highlights its dividend aristocrat status, low share price volatility and ongoing buybacks as key attractions for long term, income focused investors.
- Sees fair value close to today’s price based on steady mid single digit growth, mid 20s margins and a premium but sustainable earnings multiple.
Fair value: $67.50 per share
Implied overvaluation vs last close: 3.87%
Forecast revenue growth: 5.23%
- Emphasizes how Coca-Cola’s valuation is highly sensitive to interest rates, with even small moves in the discount rate materially shifting DCF fair value.
- Projects solid but moderating growth and margins over the next decade, with Coca-Cola gradually becoming more of a high yield compounder than a growth stock.
- Concludes that, based on current pricing versus a DCF fair value near $67.50, the shares trade at a small premium and leave only limited upside from here.
Do you think there's more to the story for Coca-Cola? Head over to our Community to see what others are saying!

This article by Simply Wall St is general in nature. We provide commentary based on historical data and analyst forecasts only using an unbiased methodology and our articles are not intended to be financial advice. It does not constitute a recommendation to buy or sell any stock, and does not take account of your objectives, or your financial situation. We aim to bring you long-term focused analysis driven by fundamental data. Note that our analysis may not factor in the latest price-sensitive company announcements or qualitative material. Simply Wall St has no position in any stocks mentioned.
Have feedback on this article? Concerned about the content? Get in touch with us directly. Alternatively, email editorial-team@simplywallst.com