
- LIVE QUOTES
- LEARN
- HELP
 Nasdaq
 Wall Street Journal
EN
Assessing Intuit’s Valuation After Strong Multi Year Run and AI Growth Optimism
- Wondering if Intuit is still worth buying after such a strong multi year run, or if most of the upside is already priced in? This breakdown will help you decide whether the current tag on the stock makes sense.
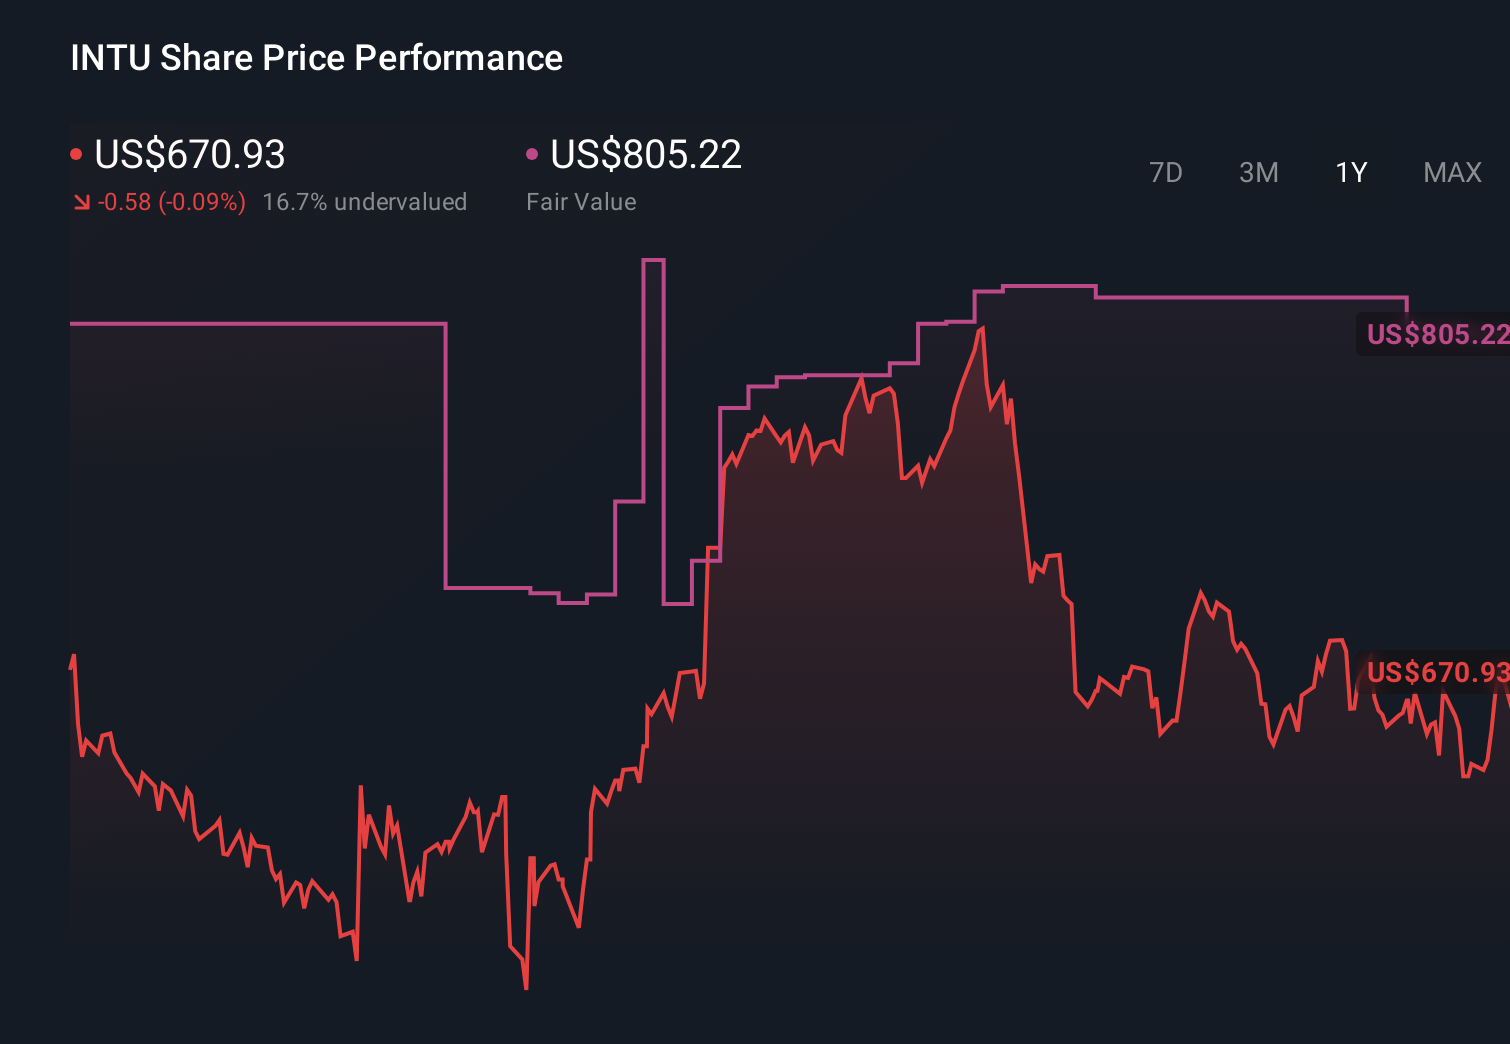
- Intuit's share price has climbed to around $674.83, with returns of 2.1% over the last week, 3.3% over the past month, 8.4% year to date, 5.3% over 1 year, and 82.8% and 85.4% over 3 and 5 years. This hints at both strong execution and rising expectations baked into the price.
- Recently, investors have been reacting to Intuit's expanding role in AI powered financial tools and its continued push to deepen the ecosystem around TurboTax, QuickBooks, and Credit Karma. This helps explain some of that long term share price strength. At the same time, increased competition across accounting and tax software has kept a spotlight on how much of Intuit's future growth is already reflected in today's valuation.
- Right now, Intuit scores a 2/6 valuation check score, suggesting it screens as undervalued on only a couple of our standard measures. In the sections ahead we will unpack what different valuation methods say about the stock and outline a more nuanced way to judge fair value that ties everything together by the end of the article.
Intuit scores just 2/6 on our valuation checks. See what other red flags we found in the full valuation breakdown.
Approach 1: Intuit Discounted Cash Flow (DCF) Analysis
A Discounted Cash Flow model estimates what a business is worth by projecting the cash it can generate in the future and discounting those dollars back to today at an appropriate rate. For Intuit, the model used is a 2 stage Free Cash Flow to Equity approach, built on cash flow projections and then tapered longer term growth assumptions.
Intuit generated about $6.25 billion in free cash flow over the last twelve months. Analyst and internal projections see this rising to roughly $16.28 billion by 2035, with around $11.76 billion expected by 2030. The early years are driven by analyst forecasts, while estimates beyond that are extrapolated by Simply Wall St based on slowing, but still positive, growth rates.
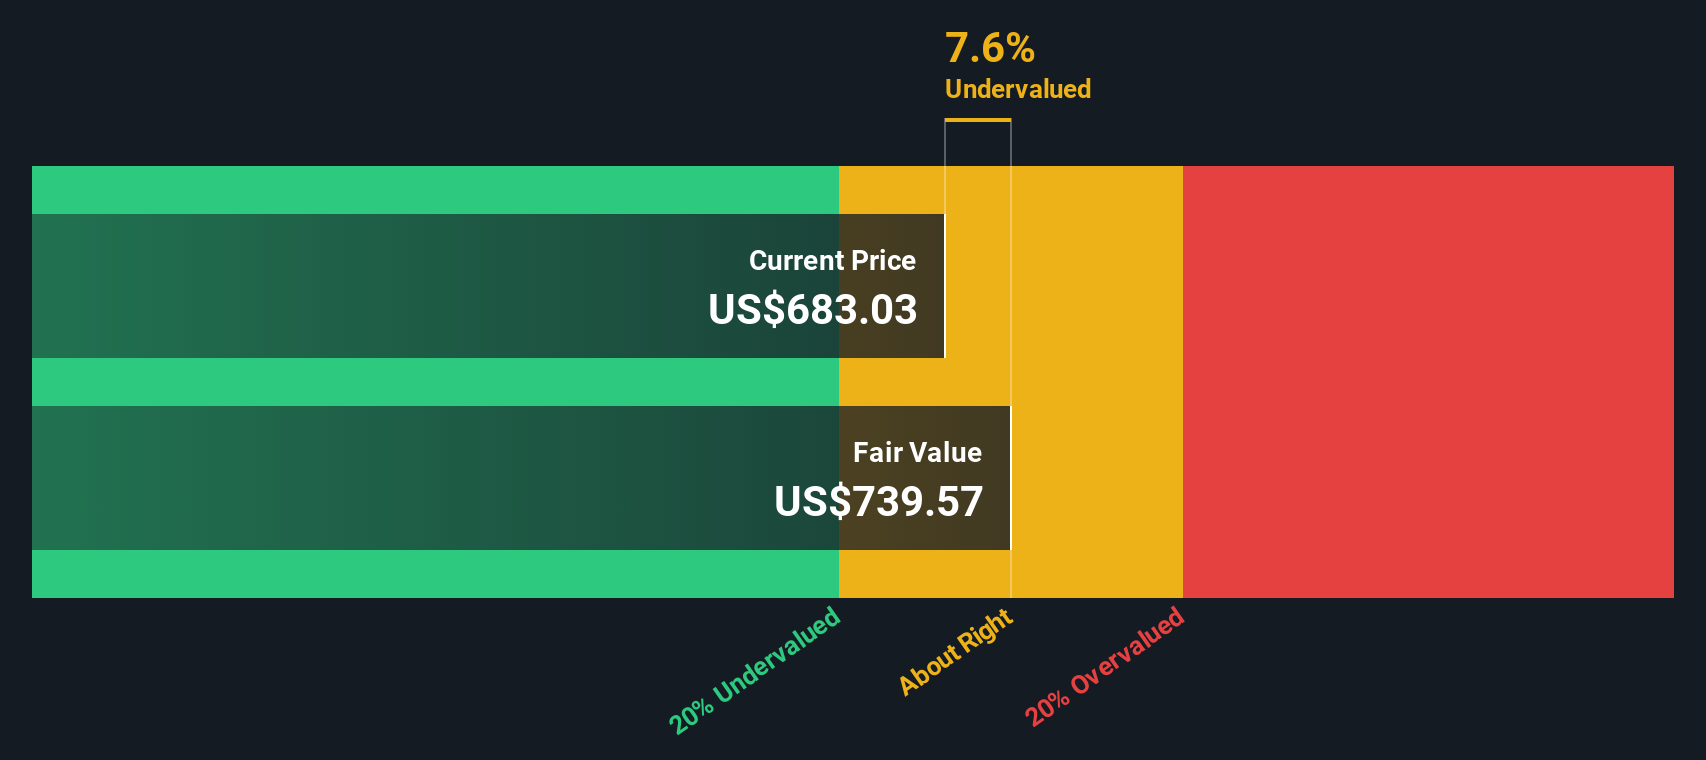
When all those projected cash flows are discounted back to today, the resulting intrinsic value comes out at roughly $764.22 per share, compared with a current market price near $674.83. That implies the stock is about 11.7% undervalued on this measure.
Result: UNDERVALUED
Our Discounted Cash Flow (DCF) analysis suggests Intuit is undervalued by 11.7%. Track this in your watchlist or portfolio, or discover 905 more undervalued stocks based on cash flows.
Approach 2: Intuit Price vs Earnings
For profitable, established businesses like Intuit, the price to earnings ratio is a practical way to gauge valuation because it directly links what investors pay for each share to the underlying earnings the company is already generating.
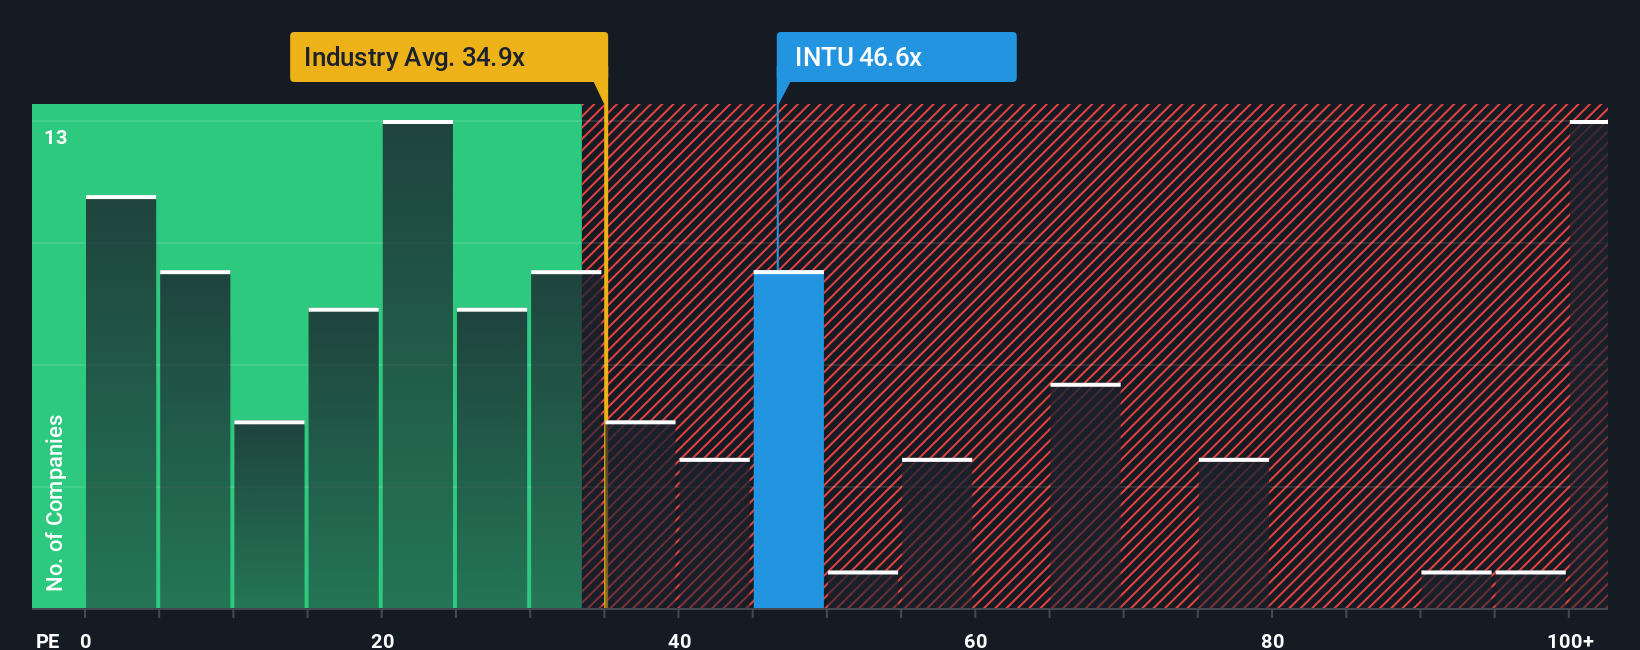
In general, faster growth and lower risk justify a higher PE multiple, while slower growth or more uncertainty call for a lower one. Intuit currently trades on about 45.6x earnings, above the broader Software industry average of roughly 31.9x, but below the peer group average near 51.9x. This suggests the market is already pricing in strong growth and resilience.
Simply Wall St also calculates a proprietary Fair Ratio for Intuit of about 40.6x, which estimates what a reasonable PE should be given its earnings growth profile, margins, risk factors, industry positioning and market cap. This is more tailored than simple peer or industry comparisons because it accounts for Intuit specific qualities rather than assuming all software names deserve the same multiple. With the actual PE at 45.6x compared with a Fair Ratio of 40.6x, the shares screen as somewhat expensive on this metric.
Result: OVERVALUED
PE ratios tell one story, but what if the real opportunity lies elsewhere? Discover 1459 companies where insiders are betting big on explosive growth.
Upgrade Your Decision Making: Choose your Intuit Narrative
Earlier we mentioned that there is an even better way to understand valuation, so let us introduce you to Narratives, which simply let you turn your view of a company into a story that connects its business drivers to a financial forecast and then to a fair value. On Simply Wall St, Narratives live in the Community page and are used by millions of investors as an easy, guided way to spell out assumptions about future revenue, earnings and margins, and see how those assumptions translate into a Fair Value that can be compared directly with today’s share price. Because Narratives are dynamically updated when new information like news, earnings or guidance drops, they stay in sync with the real world instead of being a one off spreadsheet. For Intuit, for example, one Narrative might lean bullish by assuming stronger AI agent adoption, higher Credit Karma growth and a Fair Value around the top analyst target near $971. Another more cautious Narrative could assume slower Mailchimp and international traction, softer margins and a Fair Value closer to the $600 bear case.
Do you think there's more to the story for Intuit? Head over to our Community to see what others are saying!
This article by Simply Wall St is general in nature. We provide commentary based on historical data and analyst forecasts only using an unbiased methodology and our articles are not intended to be financial advice. It does not constitute a recommendation to buy or sell any stock, and does not take account of your objectives, or your financial situation. We aim to bring you long-term focused analysis driven by fundamental data. Note that our analysis may not factor in the latest price-sensitive company announcements or qualitative material. Simply Wall St has no position in any stocks mentioned.
Have feedback on this article? Concerned about the content? Get in touch with us directly. Alternatively, email editorial-team@simplywallst.com