
- LIVE QUOTES
- LEARN
- HELP
 Nasdaq
 Wall Street Journal
EN
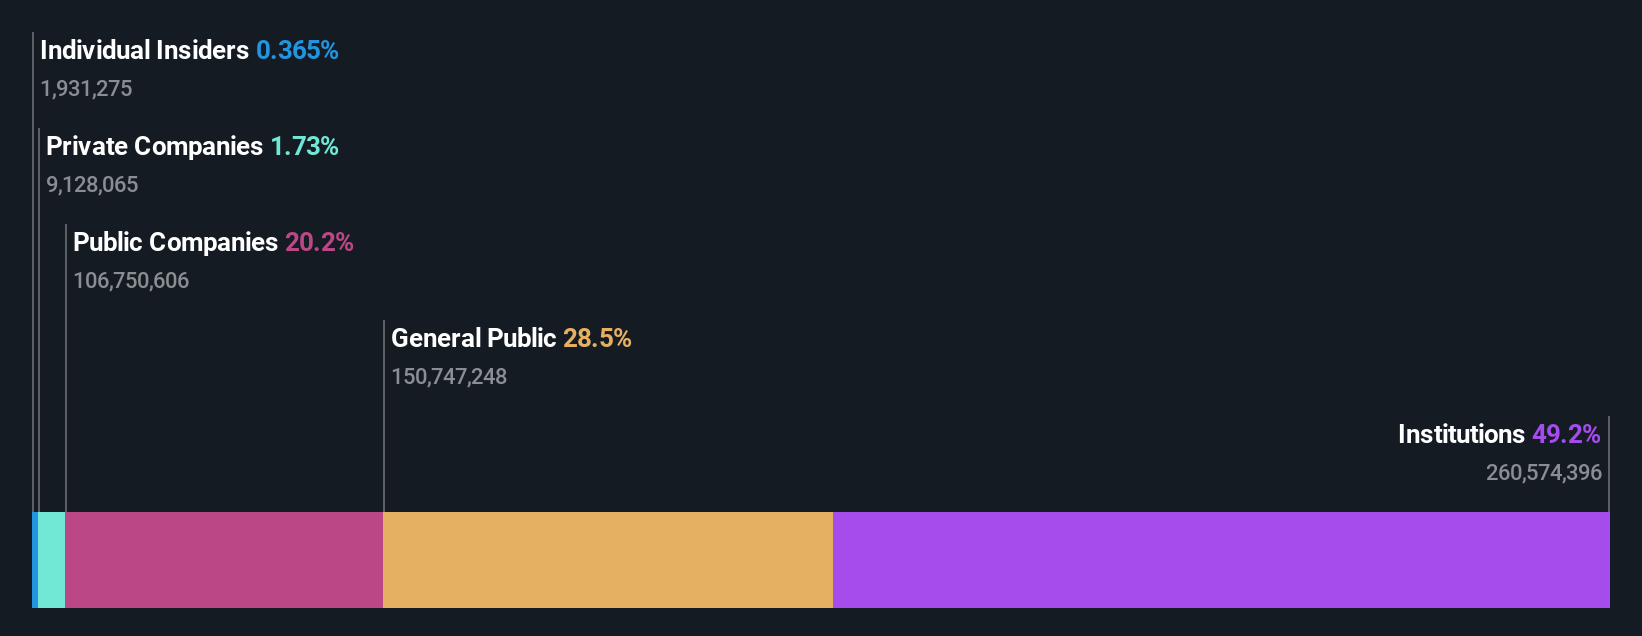
Institutional investors have a lot riding on Deterra Royalties Limited (ASX:DRR) with 49% ownership
Key Insights
- Given the large stake in the stock by institutions, Deterra Royalties' stock price might be vulnerable to their trading decisions
- A total of 7 investors have a majority stake in the company with 53% ownership
- Insiders have bought recently
To get a sense of who is truly in control of Deterra Royalties Limited (ASX:DRR), it is important to understand the ownership structure of the business. We can see that institutions own the lion's share in the company with 49% ownership. That is, the group stands to benefit the most if the stock rises (or lose the most if there is a downturn).
And things are looking up for institutional investors after the company gained AU$122m in market cap last week. The gains from last week would have further boosted the one-year return to shareholders which currently stand at 17%.
Let's take a closer look to see what the different types of shareholders can tell us about Deterra Royalties.
Check out our latest analysis for Deterra Royalties
What Does The Institutional Ownership Tell Us About Deterra Royalties?
Institutions typically measure themselves against a benchmark when reporting to their own investors, so they often become more enthusiastic about a stock once it's included in a major index. We would expect most companies to have some institutions on the register, especially if they are growing.
As you can see, institutional investors have a fair amount of stake in Deterra Royalties. This implies the analysts working for those institutions have looked at the stock and they like it. But just like anyone else, they could be wrong. If multiple institutions change their view on a stock at the same time, you could see the share price drop fast. It's therefore worth looking at Deterra Royalties' earnings history below. Of course, the future is what really matters.

Hedge funds don't have many shares in Deterra Royalties. The company's largest shareholder is Iluka Resources Limited, with ownership of 20%. For context, the second largest shareholder holds about 6.8% of the shares outstanding, followed by an ownership of 6.1% by the third-largest shareholder.
We did some more digging and found that 7 of the top shareholders account for roughly 53% of the register, implying that along with larger shareholders, there are a few smaller shareholders, thereby balancing out each others interests somewhat.
While it makes sense to study institutional ownership data for a company, it also makes sense to study analyst sentiments to know which way the wind is blowing. Quite a few analysts cover the stock, so you could look into forecast growth quite easily.
Insider Ownership Of Deterra Royalties
While the precise definition of an insider can be subjective, almost everyone considers board members to be insiders. Company management run the business, but the CEO will answer to the board, even if he or she is a member of it.
Most consider insider ownership a positive because it can indicate the board is well aligned with other shareholders. However, on some occasions too much power is concentrated within this group.
Our data suggests that insiders own under 1% of Deterra Royalties Limited in their own names. But they may have an indirect interest through a corporate structure that we haven't picked up on. It's a big company, so even a small proportional interest can create alignment between the board and shareholders. In this case insiders own AU$8.2m worth of shares. It is good to see board members owning shares, but it might be worth checking if those insiders have been buying.
General Public Ownership
The general public-- including retail investors -- own 28% stake in the company, and hence can't easily be ignored. While this group can't necessarily call the shots, it can certainly have a real influence on how the company is run.
Public Company Ownership
We can see that public companies hold 20% of the Deterra Royalties shares on issue. We can't be certain but it is quite possible this is a strategic stake. The businesses may be similar, or work together.
Next Steps:
While it is well worth considering the different groups that own a company, there are other factors that are even more important. Like risks, for instance. Every company has them, and we've spotted 3 warning signs for Deterra Royalties (of which 1 makes us a bit uncomfortable!) you should know about.
If you would prefer discover what analysts are predicting in terms of future growth, do not miss this free report on analyst forecasts.
NB: Figures in this article are calculated using data from the last twelve months, which refer to the 12-month period ending on the last date of the month the financial statement is dated. This may not be consistent with full year annual report figures.
Have feedback on this article? Concerned about the content? Get in touch with us directly. Alternatively, email editorial-team (at) simplywallst.com.
This article by Simply Wall St is general in nature. We provide commentary based on historical data and analyst forecasts only using an unbiased methodology and our articles are not intended to be financial advice. It does not constitute a recommendation to buy or sell any stock, and does not take account of your objectives, or your financial situation. We aim to bring you long-term focused analysis driven by fundamental data. Note that our analysis may not factor in the latest price-sensitive company announcements or qualitative material. Simply Wall St has no position in any stocks mentioned.