
- LIVE QUOTES
- LEARN
- HELP
 Nasdaq
 Wall Street Journal
EN
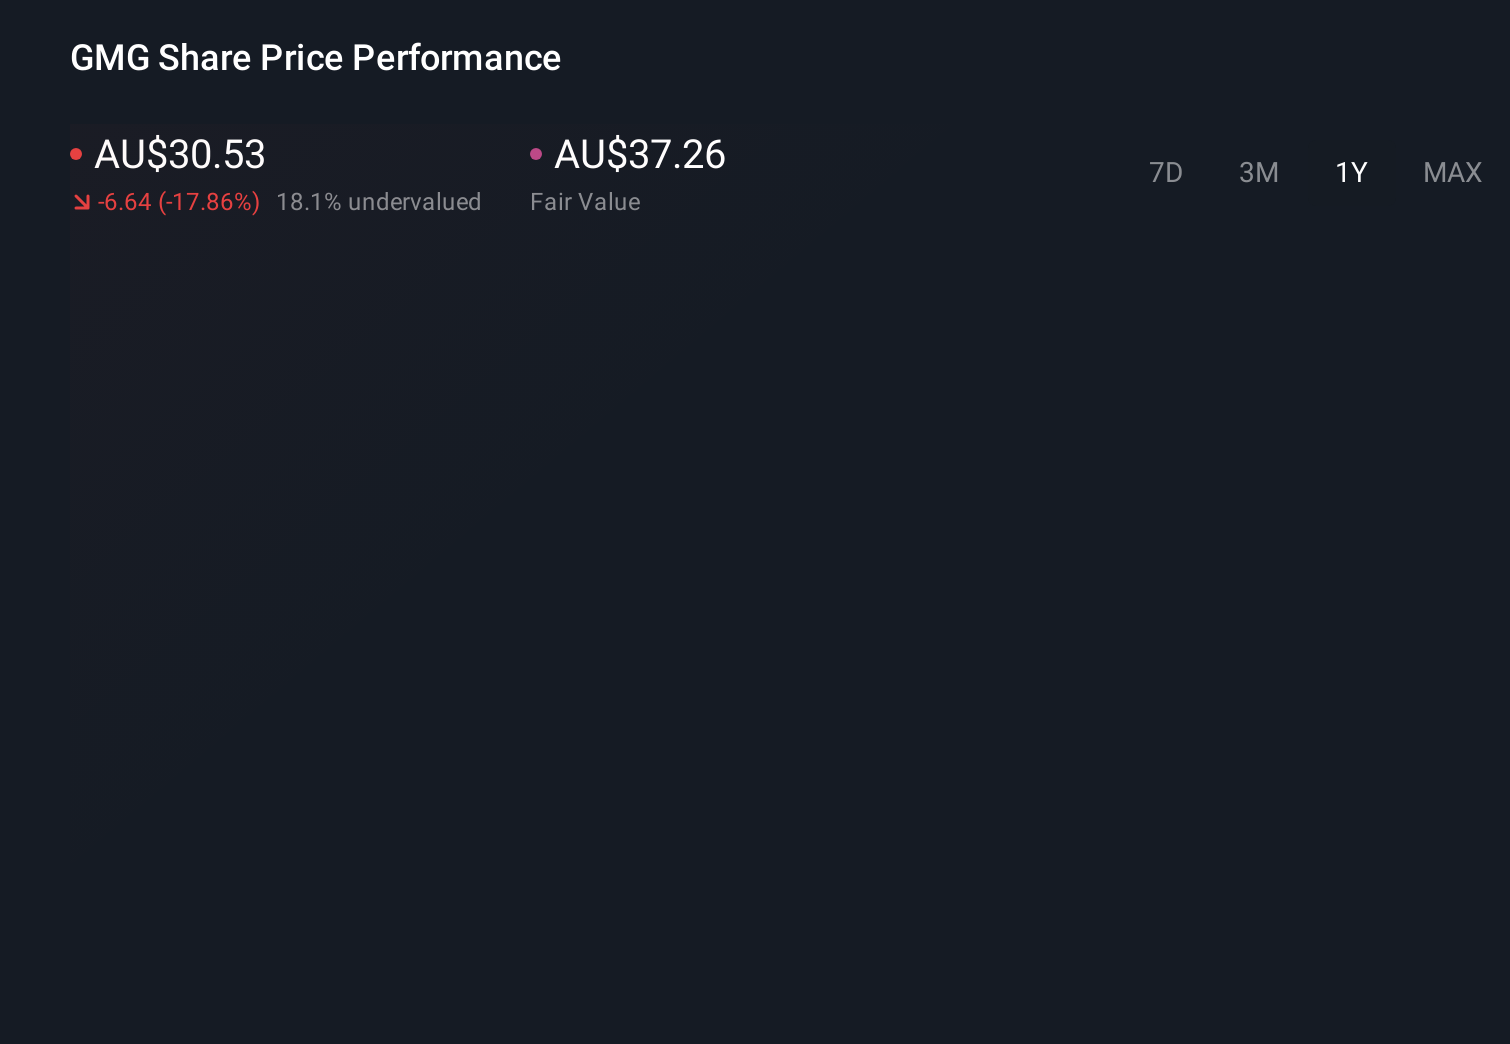
Is Goodman Group Still Worth the Premium After a 19% Share Price Slide?
- If you have been wondering whether Goodman Group is starting to look like value again after a rocky stretch, you are not alone, and this article is going to unpack exactly that question.
- The stock is down 19.4% over the last year and 18.9% year to date, even though it is still up 73.6% over three years and 63.5% over five, a mix that suggests both bruised sentiment and longer term strength.
- Recently, investors have been reacting to shifting views on logistics and data center real estate, with Goodman often cited as a key player in the build out of modern warehousing and infrastructure. At the same time, broader concerns about interest rates and commercial property valuations have added volatility and helped drive the share price swings we are seeing.
- On our scorecard, Goodman scores just 1 out of 6 on valuation checks, suggesting the market is not obviously mispricing it on most conventional metrics, but headline numbers never tell the full story. Next, we will walk through the main valuation approaches investors are using on Goodman today, and then circle back at the end to a more complete way of thinking about what the stock is really worth.
Goodman Group scores just 1/6 on our valuation checks. See what other red flags we found in the full valuation breakdown.
Approach 1: Goodman Group Discounted Cash Flow (DCF) Analysis
A Discounted Cash Flow, or DCF, model estimates what a business is worth today by projecting its future cash flows and discounting them back to their present value. For Goodman Group, the model starts from last twelve months Free Cash Flow of about A$959.6 million and uses analyst forecasts for several years, then extrapolates further out to build a longer term picture.
Analysts see Free Cash Flow rising to around A$1.40 billion by 2026 and A$1.88 billion by 2028, with Simply Wall St extending those projections through to 2035 using a 2 Stage Free Cash Flow to Equity framework. These growing cash flows are then discounted to reflect risk and the time value of money, producing an estimated intrinsic value of about A$16.99 per share.
Compared to the current share price, this implies Goodman is about 72.0% overvalued on a DCF basis, suggesting the market is paying a heavy premium for its future growth and quality.
Result: OVERVALUED
Our Discounted Cash Flow (DCF) analysis suggests Goodman Group may be overvalued by 72.0%. Discover 898 undervalued stocks or create your own screener to find better value opportunities.

Approach 2: Goodman Group Price vs Earnings
For a consistently profitable business like Goodman Group, the Price to Earnings, or PE, ratio is a useful way to see how much investors are willing to pay for each dollar of earnings. In general, companies with stronger growth prospects and lower perceived risk can justify a higher PE, while slower growing or riskier firms usually deserve a lower multiple.
Goodman currently trades on about 35.9x earnings, which is well above both the Industrial REITs industry average of roughly 16.4x and a broader peer average of about 25.1x. That premium signals the market is baking in superior growth and quality, but it also raises the bar for future performance.
Simply Wall St estimates a Fair Ratio for Goodman of around 20.0x. This is a proprietary PE level that reflects its specific mix of earnings growth, margins, industry, market cap and risk profile. This is more tailored than a simple comparison with peers or the sector, because it adjusts for what actually makes Goodman different rather than assuming one size fits all. With the current PE of 35.9x sitting well above the 20.0x Fair Ratio, the stock screens as expensive on an earnings multiple basis.
Result: OVERVALUED

PE ratios tell one story, but what if the real opportunity lies elsewhere? Discover 1458 companies where insiders are betting big on explosive growth.
Upgrade Your Decision Making: Choose your Goodman Group Narrative
Earlier we mentioned that there is an even better way to understand valuation, so let us introduce you to Narratives, a simple framework that lets you attach a clear story, your expectations for Goodman Group’s revenue, earnings and margins, and a resulting fair value to the raw numbers you see on screen.
A Narrative links what you believe about a company’s future, for example Goodman’s ability to scale data centers and modern logistics globally, to a concrete financial forecast and then to an explicit fair value estimate that you can compare directly with today’s share price to help inform whether it appears to be a buy, a hold, or a sell.
On Simply Wall St, Narratives sit inside the Community page and are designed to be easy and accessible. They dynamically update when fresh information such as earnings or major news is released, so your view of fair value evolves as the story does.
For example, one Goodman Narrative on the platform currently sees fair value around A$29 per share, while a more optimistic Narrative is closer to A$41.50. By exploring these side by side you can quickly see how different assumptions about AI driven data center demand, margins and risk can lead to very different conclusions on what the stock may be worth today.
Do you think there's more to the story for Goodman Group? Head over to our Community to see what others are saying!
This article by Simply Wall St is general in nature. We provide commentary based on historical data and analyst forecasts only using an unbiased methodology and our articles are not intended to be financial advice. It does not constitute a recommendation to buy or sell any stock, and does not take account of your objectives, or your financial situation. We aim to bring you long-term focused analysis driven by fundamental data. Note that our analysis may not factor in the latest price-sensitive company announcements or qualitative material. Simply Wall St has no position in any stocks mentioned.
Have feedback on this article? Concerned about the content? Get in touch with us directly. Alternatively, email editorial-team@simplywallst.com