
- LIVE QUOTES
- LEARN
- HELP
 Nasdaq
 Wall Street Journal
EN
Has Capital One’s Surging Share Price Outrun Its Fundamentals After The Discover Deal?
- Wondering if Capital One Financial is still a smart buy after its huge run, or if the value story has already played out? This article will walk through exactly what the numbers are saying about the stock today.
- The share price has climbed to around $246.77, delivering gains of 2.9% over the last week, 18.7% over the last month, 38.1% year to date, 38.9% over the past year, and 186.6% over three years and 176.7% over five years, which naturally raises questions about how much upside might be left.
- Behind these moves, markets have been reacting to shifting expectations around credit quality, consumer spending, and the broader interest rate backdrop, all of which directly affect Capital One s lending margins and growth runway. In addition, ongoing developments in digital banking, competition from fintechs, and regulatory scrutiny of large financial institutions are shaping how investors think about the company s risk and reward profile.
- Despite that momentum, Capital One currently scores just 1/6 on our valuation checks, suggesting that by some traditional measures the stock is not obviously undervalued, at least on the surface. In the next sections we will unpack what different valuation methods say about the stock s fair value, and later on we will explore a more nuanced way to think about valuation that goes beyond simple multiples and models.
Capital One Financial scores just 1/6 on our valuation checks. See what other red flags we found in the full valuation breakdown.
Approach 1: Capital One Financial Excess Returns Analysis
The Excess Returns model looks at how much profit Capital One Financial can generate above the return that shareholders require, and then capitalizes those surplus profits into an intrinsic value per share.
In this framework, Capital One starts with a Book Value of $170.52 per share and a Stable Book Value projection of $183.87 per share, based on forward looking estimates from 8 analysts. Those same analyst forecasts imply Stable EPS of $22.44 per share and an Average Return on Equity of 12.20%, which is then compared with a required Cost of Equity of $15.97 per share.
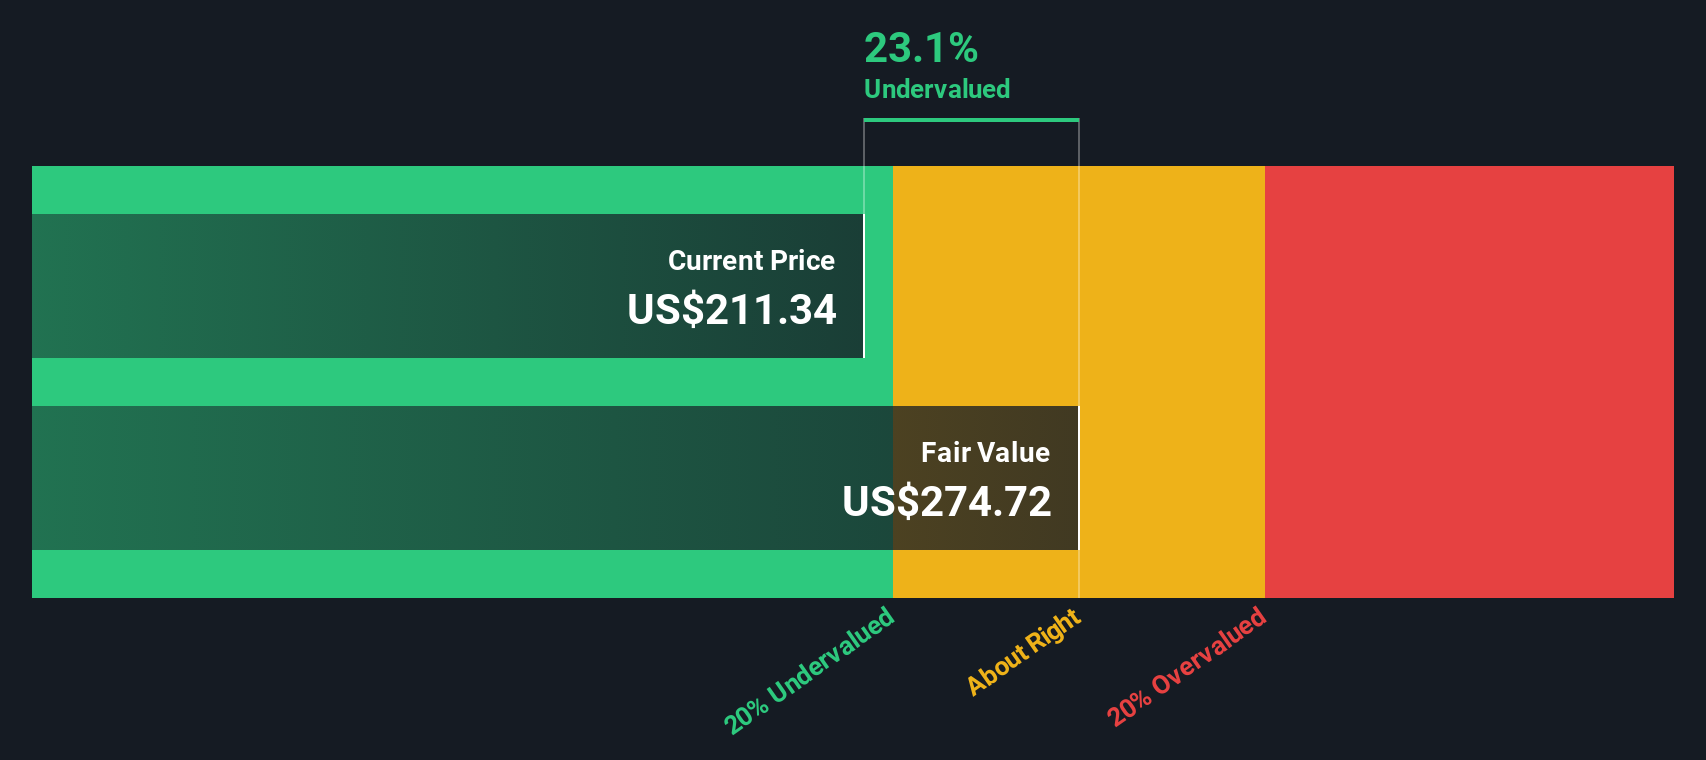
The difference between what Capital One is expected to earn and what investors demand translates into an Excess Return of $6.47 per share. Aggregating and discounting these excess returns produces an intrinsic value estimate of about $303.23 per share, implying the stock is trading at roughly an 18.6% discount to this estimate of fair value.
On this basis, Capital One shares appear meaningfully undervalued rather than fully priced in.
Result: UNDERVALUED
Our Excess Returns analysis suggests Capital One Financial is undervalued by 18.6%. Track this in your watchlist or portfolio, or discover 898 more undervalued stocks based on cash flows.
Approach 2: Capital One Financial Price vs Earnings
For profitable companies like Capital One Financial, the price to earnings ratio is a useful way to gauge how much investors are willing to pay today for each dollar of current earnings. It naturally ties valuation to profitability, while also reflecting what the market expects those earnings to do in the future.
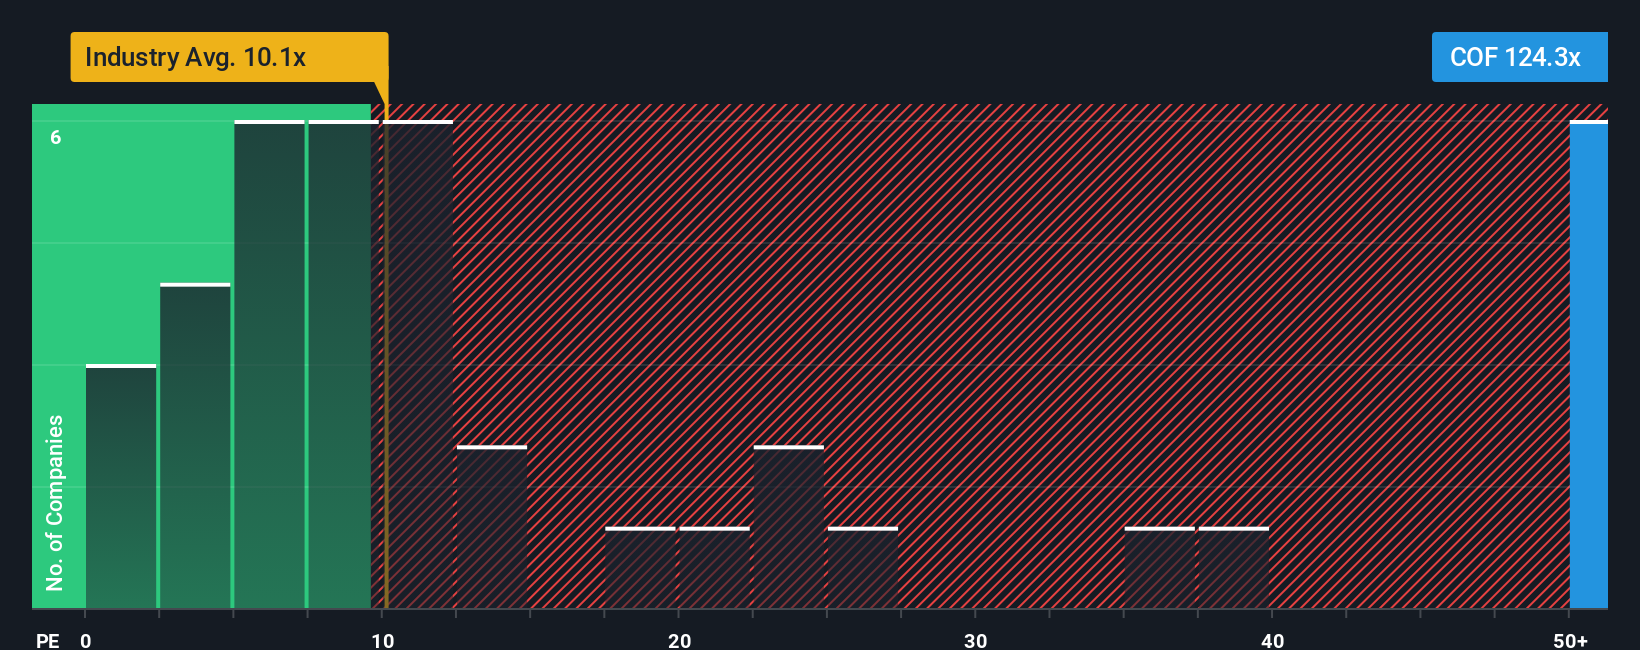
In practice, a higher PE can be justified when investors expect stronger, more reliable growth and see lower risk, while slower growth or higher uncertainty usually warrant a lower, more conservative PE. Capital One currently trades on a very elevated PE of about 136.3x, compared with the Consumer Finance industry average of roughly 10.0x and a broader peer average near 28.8x. This implies the market is pricing in exceptional prospects or unusually low perceived risk.
To refine that view, Simply Wall St uses a proprietary Fair Ratio for the PE, which for Capital One is 30.9x. This Fair Ratio estimates what a reasonable PE should be after accounting for the company s earnings growth profile, profitability, risk factors, industry, and market cap, making it a more tailored benchmark than simple peer or industry comparisons. With the current PE of 136.3x sitting far above this 30.9x Fair Ratio, the shares look meaningfully stretched on a multiples basis.
Result: OVERVALUED
PE ratios tell one story, but what if the real opportunity lies elsewhere? Discover 1457 companies where insiders are betting big on explosive growth.
Upgrade Your Decision Making: Choose your Capital One Financial Narrative
Earlier we mentioned that there is an even better way to understand valuation, so let us introduce you to Narratives, which are simply your story about a company linked directly to a set of numbers, like your assumptions for future revenue, earnings and margins, that roll up into a fair value estimate.
On Simply Wall St s Community page, used by millions of investors, a Narrative turns your view of Capital One Financial into a clear financial forecast and fair value. It then tracks how that fair value compares with today s share price so you can see how your story translates into a buy, hold, or sell stance.
Because Narratives refresh dynamically when new information arrives, such as earnings results, news about the Discover acquisition, or updates to analyst estimates, your valuation view evolves automatically instead of going stale.
For example, one investor might build a bullish Narrative that assumes the Discover deal drives strong payments growth and higher margins, leading to a fair value closer to the high analyst target of about $265. A more cautious investor might emphasize integration risks, rising credit costs, and slower growth, anchoring their Narrative nearer the low target around $160 and, as a result, reaching very different decisions at today s price.
Do you think there's more to the story for Capital One Financial? Head over to our Community to see what others are saying!

This article by Simply Wall St is general in nature. We provide commentary based on historical data and analyst forecasts only using an unbiased methodology and our articles are not intended to be financial advice. It does not constitute a recommendation to buy or sell any stock, and does not take account of your objectives, or your financial situation. We aim to bring you long-term focused analysis driven by fundamental data. Note that our analysis may not factor in the latest price-sensitive company announcements or qualitative material. Simply Wall St has no position in any stocks mentioned.
Have feedback on this article? Concerned about the content? Get in touch with us directly. Alternatively, email editorial-team@simplywallst.com