
- LIVE QUOTES
- LEARN
- HELP
 Nasdaq
 Wall Street Journal
EN
Insiders the biggest winners as ULS Group, Inc.'s (TSE:3798) market cap rises to JP¥35b
Key Insights
- Significant insider control over ULS Group implies vested interests in company growth
- The top 3 shareholders own 54% of the company
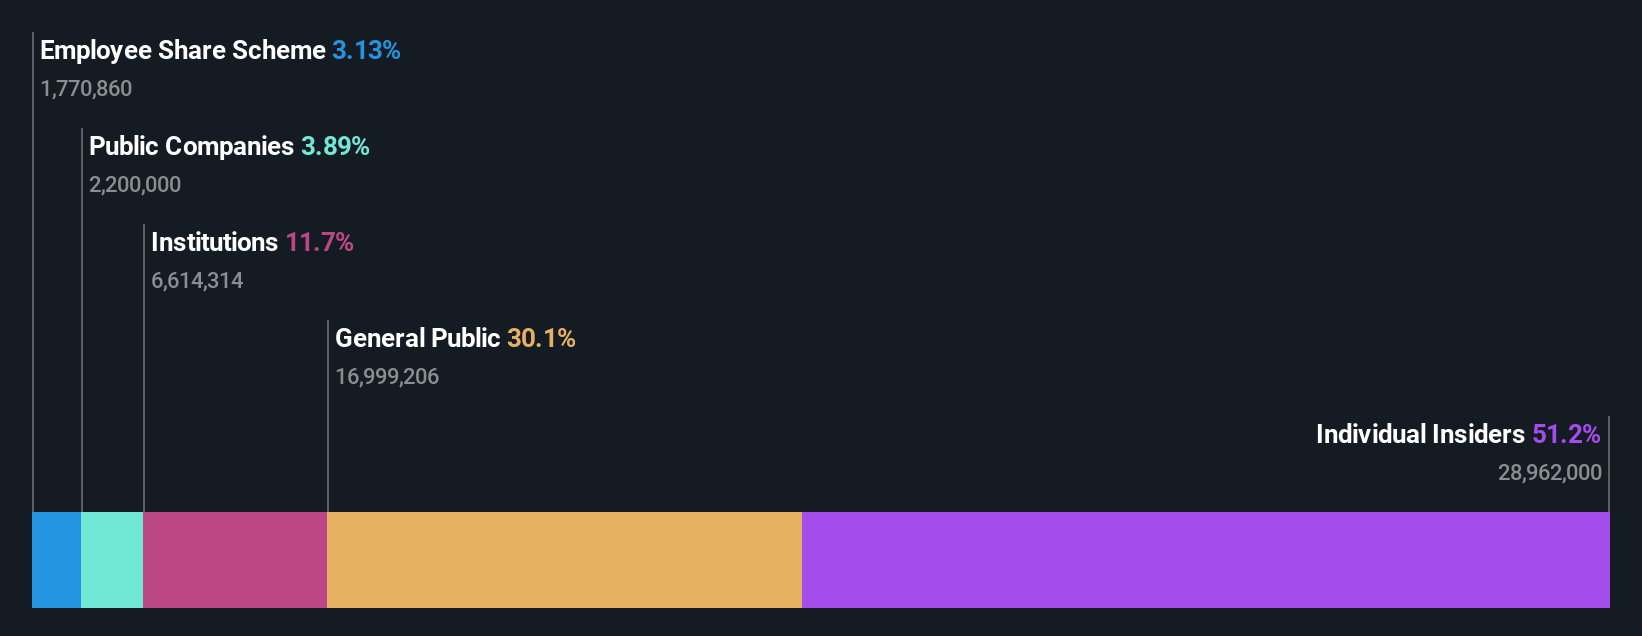
- 12% of ULS Group is held by Institutions
To get a sense of who is truly in control of ULS Group, Inc. (TSE:3798), it is important to understand the ownership structure of the business. We can see that individual insiders own the lion's share in the company with 51% ownership. In other words, the group stands to gain the most (or lose the most) from their investment into the company.
Clearly, insiders benefitted the most after the company's market cap rose by JP¥3.3b last week.
Let's delve deeper into each type of owner of ULS Group, beginning with the chart below.
See our latest analysis for ULS Group
What Does The Institutional Ownership Tell Us About ULS Group?
Many institutions measure their performance against an index that approximates the local market. So they usually pay more attention to companies that are included in major indices.
ULS Group already has institutions on the share registry. Indeed, they own a respectable stake in the company. This can indicate that the company has a certain degree of credibility in the investment community. However, it is best to be wary of relying on the supposed validation that comes with institutional investors. They too, get it wrong sometimes. It is not uncommon to see a big share price drop if two large institutional investors try to sell out of a stock at the same time. So it is worth checking the past earnings trajectory of ULS Group, (below). Of course, keep in mind that there are other factors to consider, too.

We note that hedge funds don't have a meaningful investment in ULS Group. Looking at our data, we can see that the largest shareholder is Shigeru Urushibara with 45% of shares outstanding. For context, the second largest shareholder holds about 5.2% of the shares outstanding, followed by an ownership of 3.9% by the third-largest shareholder. Keiichi Takahashi, who is the second-largest shareholder, also happens to hold the title of Chief Financial Officer.
To make our study more interesting, we found that the top 3 shareholders have a majority ownership in the company, meaning that they are powerful enough to influence the decisions of the company.
While studying institutional ownership for a company can add value to your research, it is also a good practice to research analyst recommendations to get a deeper understand of a stock's expected performance. There is some analyst coverage of the stock, but it could still become more well known, with time.
Insider Ownership Of ULS Group
The definition of company insiders can be subjective and does vary between jurisdictions. Our data reflects individual insiders, capturing board members at the very least. Company management run the business, but the CEO will answer to the board, even if he or she is a member of it.
Insider ownership is positive when it signals leadership are thinking like the true owners of the company. However, high insider ownership can also give immense power to a small group within the company. This can be negative in some circumstances.
Our most recent data indicates that insiders own the majority of ULS Group, Inc.. This means they can collectively make decisions for the company. That means they own JP¥18b worth of shares in the JP¥35b company. That's quite meaningful. It is good to see this level of investment. You can check here to see if those insiders have been buying recently.
General Public Ownership
The general public-- including retail investors -- own 30% stake in the company, and hence can't easily be ignored. While this group can't necessarily call the shots, it can certainly have a real influence on how the company is run.
Public Company Ownership
We can see that public companies hold 3.9% of the ULS Group shares on issue. It's hard to say for sure but this suggests they have entwined business interests. This might be a strategic stake, so it's worth watching this space for changes in ownership.
Next Steps:
It's always worth thinking about the different groups who own shares in a company. But to understand ULS Group better, we need to consider many other factors. For example, we've discovered 2 warning signs for ULS Group (1 is a bit concerning!) that you should be aware of before investing here.
If you would prefer discover what analysts are predicting in terms of future growth, do not miss this free report on analyst forecasts.
NB: Figures in this article are calculated using data from the last twelve months, which refer to the 12-month period ending on the last date of the month the financial statement is dated. This may not be consistent with full year annual report figures.
Have feedback on this article? Concerned about the content? Get in touch with us directly. Alternatively, email editorial-team (at) simplywallst.com.
This article by Simply Wall St is general in nature. We provide commentary based on historical data and analyst forecasts only using an unbiased methodology and our articles are not intended to be financial advice. It does not constitute a recommendation to buy or sell any stock, and does not take account of your objectives, or your financial situation. We aim to bring you long-term focused analysis driven by fundamental data. Note that our analysis may not factor in the latest price-sensitive company announcements or qualitative material. Simply Wall St has no position in any stocks mentioned.