
- LIVE QUOTES
- LEARN
- HELP
 Nasdaq
 Wall Street Journal
EN
Has Bloom Energy’s 280% Surge in 2025 Overshot Its Long Term Growth Story?
- If you are wondering whether Bloom Energy is still worth pursuing after its huge run, or if the easy money has already been made, this article unpacks what the market might be getting right and wrong about the stock.
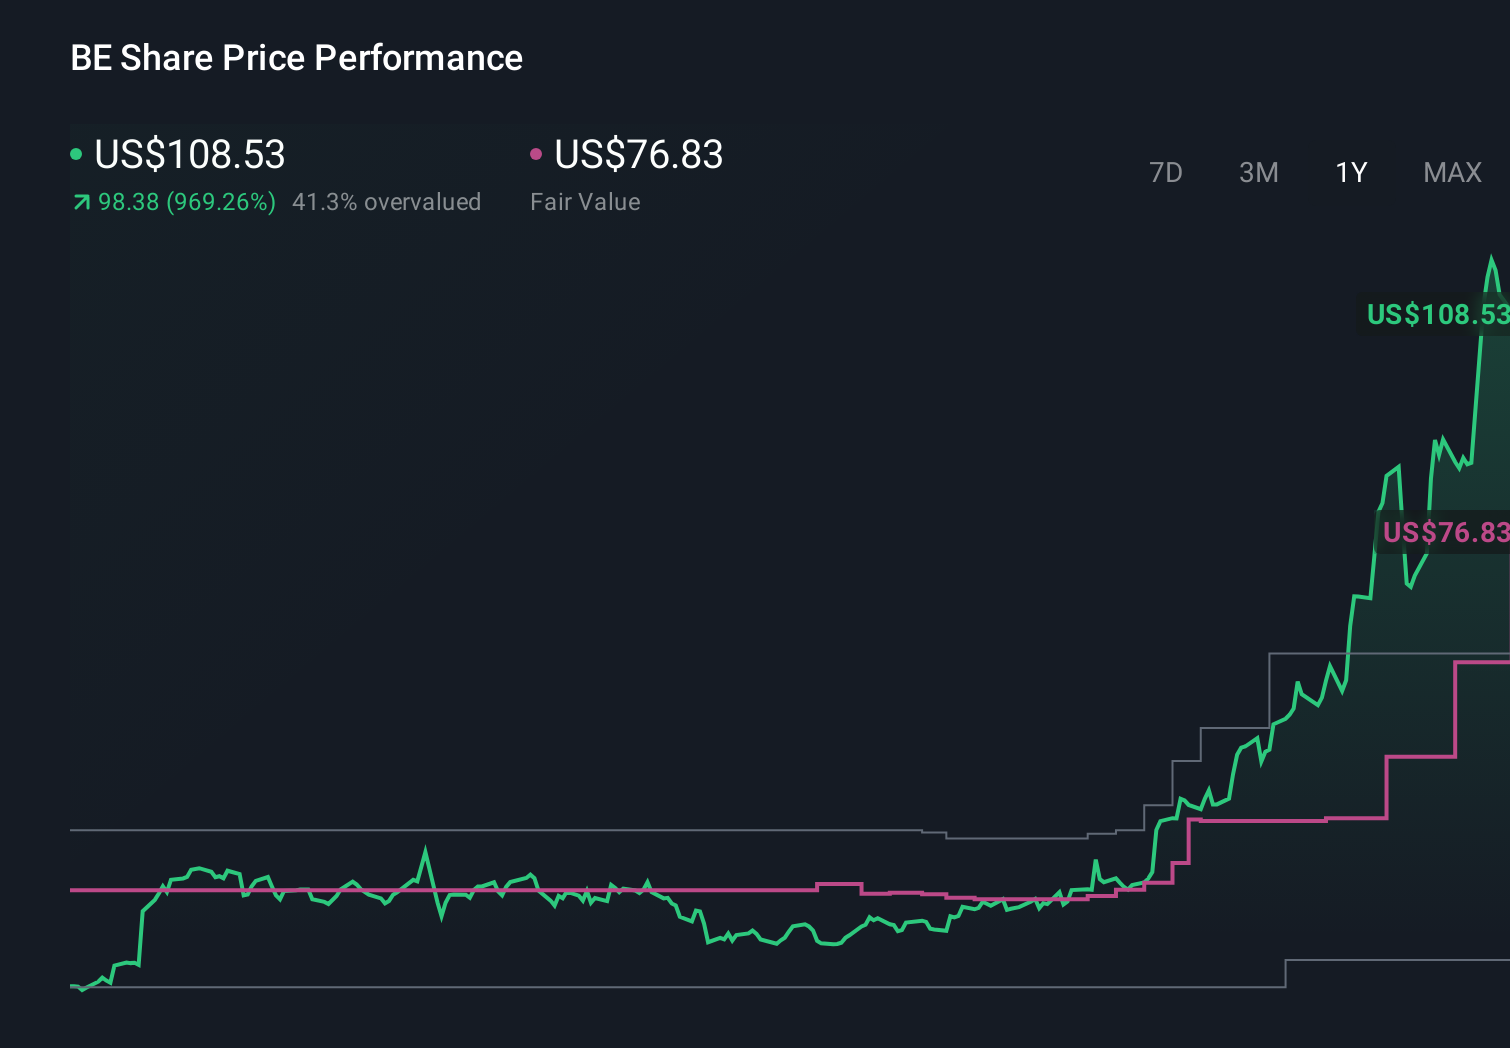
- The share price has cooled slightly in the very short term, slipping around 0.8% over the last week and 1.3% over the past month. However, that comes after a 280.1% year-to-date gain and a 267.0% increase over the last year.
- Behind those moves, investors have been reacting to a steady drumbeat of headlines around clean energy policy support, new hydrogen and fuel cell project announcements, and growing interest from industrial and utility partners looking to decarbonize their power needs. Together, these developments have reinforced the idea that Bloom is tied to a long-term energy transition theme, even as sentiment swings with each new contract or regulatory update.
- Despite the excitement, Bloom currently only scores a 2/6 on our valuation checks. In this article, we will break down what different valuation methods say about the stock and, by the end, explore a more nuanced way to think about what Bloom might really be worth.
Bloom Energy scores just 2/6 on our valuation checks. See what other red flags we found in the full valuation breakdown.
Approach 1: Bloom Energy Discounted Cash Flow (DCF) Analysis
A Discounted Cash Flow, or DCF, model estimates what a company is worth by projecting its future cash flows and then discounting them back to today, adjusting for risk and the time value of money.
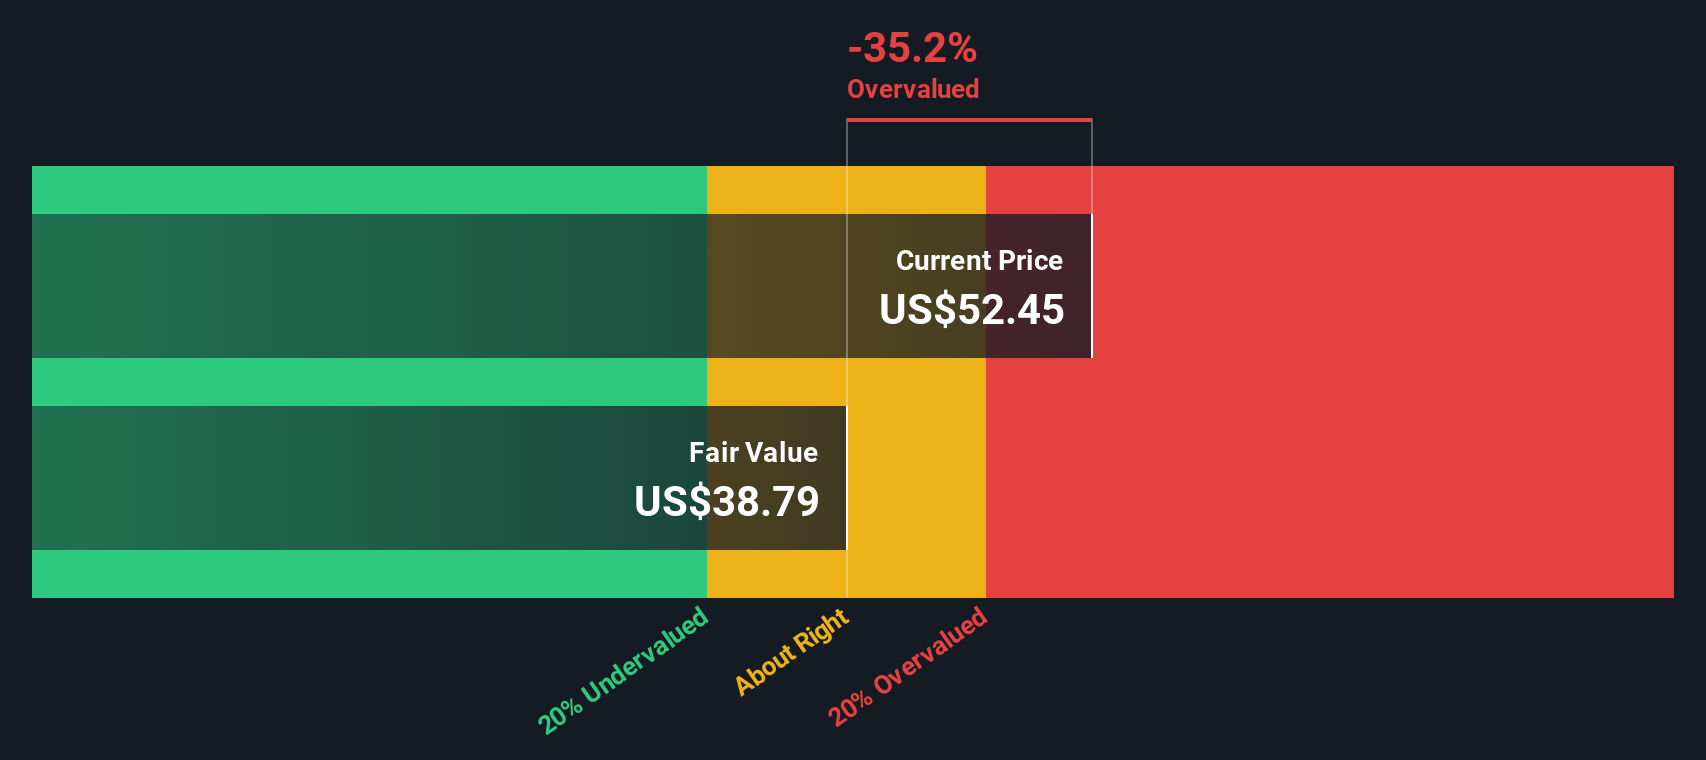
For Bloom Energy, the latest twelve month free cash flow sits at about $94.6 Million. Analysts expect this to climb rapidly, with projections reaching around $1.55 Billion by 2029, and a longer term path that extends those forecasts out to 2035 using Simply Wall St extrapolations. These rising cash flows, all measured in $, are fed into a two stage Free Cash Flow to Equity model. This produces an estimated intrinsic value of roughly $148.03 per share.
Compared to the current share price, this implies the stock is about 40.0% undervalued according to the DCF framework. For investors who believe Bloom can deliver on these ambitious cash flow targets, the model suggests there is still meaningful upside left in the story.
Result: UNDERVALUED
Our Discounted Cash Flow (DCF) analysis suggests Bloom Energy is undervalued by 40.0%. Track this in your watchlist or portfolio, or discover 904 more undervalued stocks based on cash flows.
Approach 2: Bloom Energy Price vs Sales
For companies like Bloom that are still working toward consistent profitability, the price to sales ratio is often a more reliable yardstick than earnings based multiples, because it focuses on the revenue engine rather than volatile or negative profits.
In general, the higher a company’s expected growth and the lower its perceived risk, the more investors are willing to pay per dollar of sales, so a higher price to sales multiple can be justified. Conversely, slower growth or higher uncertainty usually call for a lower, more conservative multiple.
Bloom currently trades at about 11.55x sales, which is well above the Electrical industry average of roughly 2.34x and also ahead of the peer group average of around 5.31x. Simply Wall St’s proprietary Fair Ratio, which estimates what Bloom’s multiple should be after considering its growth outlook, margins, risk profile, industry and size, comes in lower at about 8.34x. This Fair Ratio is more informative than a simple peer or industry comparison, because it adjusts for Bloom’s specific fundamentals rather than assuming all companies deserve similar pricing. On this basis, Bloom looks somewhat expensive relative to its tailored fair value multiple.
Result: OVERVALUED
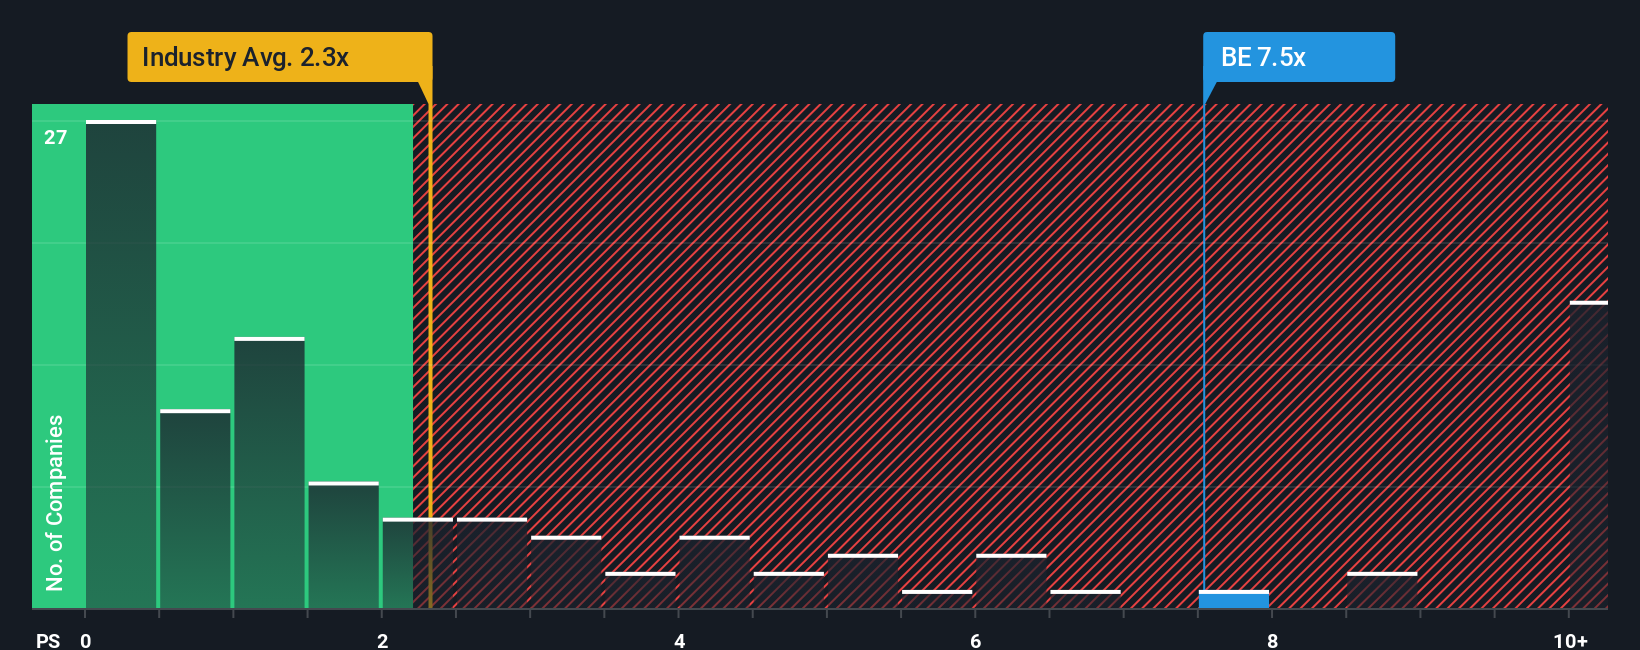
PS ratios tell one story, but what if the real opportunity lies elsewhere? Discover 1459 companies where insiders are betting big on explosive growth.
Upgrade Your Decision Making: Choose your Bloom Energy Narrative
Earlier we mentioned that there is an even better way to understand valuation, so let us introduce you to Narratives, a simple way to connect your view of Bloom Energy’s story with the numbers behind revenue, earnings, margins and, ultimately, fair value.
A Narrative on Simply Wall St is your own, structured story for a company, where you spell out what you think will drive its future and then link those beliefs to a concrete financial forecast and a fair value estimate, instead of just accepting a single static target price.
On the Community page, millions of investors can quickly build and compare Narratives that translate their assumptions into projected financials and a fair value, then line that up against today’s share price to help them decide whether Bloom looks like a buy, hold or sell for their own situation.
Because Narratives on Simply Wall St update dynamically as new information such as news, partnerships or earnings arrives, your view stays live rather than locked in a spreadsheet. You can immediately see how the highest Bloom fair value of $112.50 and the lowest analyst target of $10.00 reflect very different beliefs about the durability of AI-driven power demand, competitive threats and long term profitability.
Do you think there's more to the story for Bloom Energy? Head over to our Community to see what others are saying!
This article by Simply Wall St is general in nature. We provide commentary based on historical data and analyst forecasts only using an unbiased methodology and our articles are not intended to be financial advice. It does not constitute a recommendation to buy or sell any stock, and does not take account of your objectives, or your financial situation. We aim to bring you long-term focused analysis driven by fundamental data. Note that our analysis may not factor in the latest price-sensitive company announcements or qualitative material. Simply Wall St has no position in any stocks mentioned.
Have feedback on this article? Concerned about the content? Get in touch with us directly. Alternatively, email editorial-team@simplywallst.com