
- LIVE QUOTES
- LEARN
- HELP
 Nasdaq
 Wall Street Journal
EN
Is DraftKings Stock Offering Value After a 196% Three Year Surge?
- If you are wondering whether DraftKings at around $34 a share is a bargain or a bubble, you are not alone. This article walks through what the numbers really say about its value.
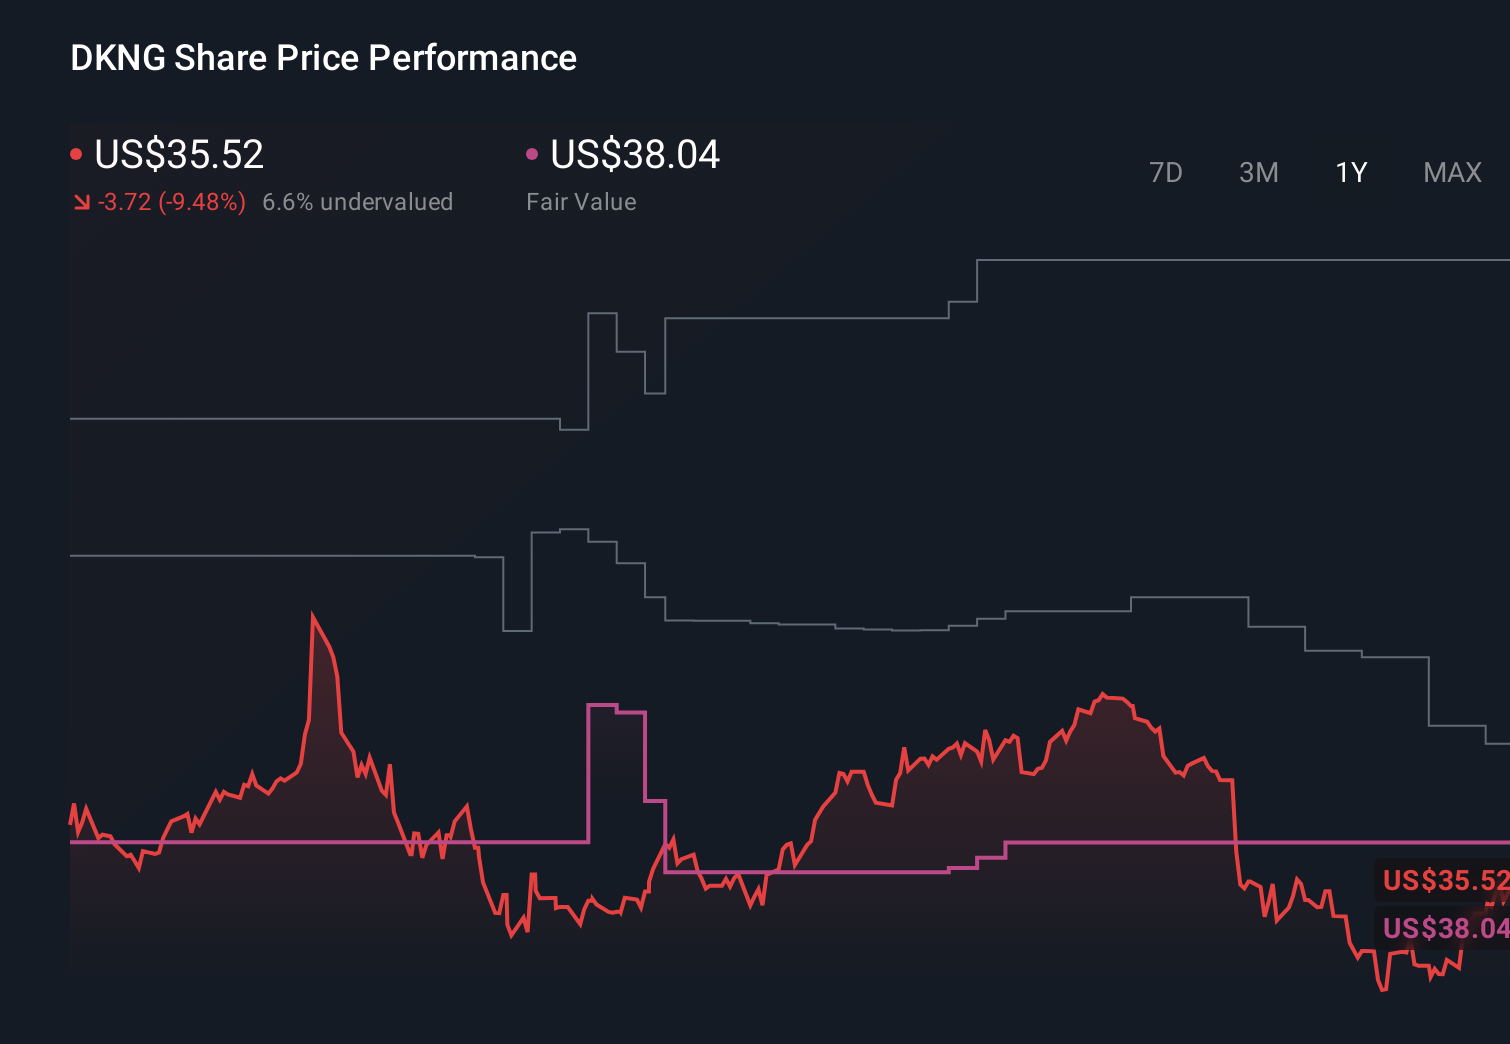
- Over the last month the stock is up 14.1%, but that comes after a choppy run, with the shares down 3.9% over the past week, 5.7% year to date, and 10.8% over the last year. The 3 year return still sits at an eye catching 196.7%.
- Those swings have been underpinned by ongoing state by state legalization and expansion in online sports betting and iGaming, as well as growing investor debate about how sustainable DraftKings customer growth and marketing spend really are. At the same time, regulatory headlines and shifting sentiment toward higher risk growth names have kept volatility elevated, making valuation analysis even more important.
- Right now DraftKings scores a 3/6 valuation score, suggesting it screens as undervalued on about half of the checks we run. However, that headline number only tells part of the story, so we will break down the key valuation approaches next and then finish with a more powerful way to think about what the stock is really worth.
Find out why DraftKings's -10.8% return over the last year is lagging behind its peers.
Approach 1: DraftKings Discounted Cash Flow (DCF) Analysis
A Discounted Cash Flow model estimates what a business is worth by projecting the cash it can generate in the future and then discounting those cash flows back to today in dollar terms. For DraftKings, the 2 Stage Free Cash Flow to Equity model starts with last twelve month free cash flow of about $514 million and assumes this grows rapidly as the business scales.
Analysts provide explicit forecasts for the next few years, with Simply Wall St extrapolating further. By 2029, DraftKings free cash flow is projected to reach roughly $2.16 billion, and the 10 year path out to 2035 continues to rise into the low to mid single digit billions, reflecting expectations of strong but gradually moderating growth.
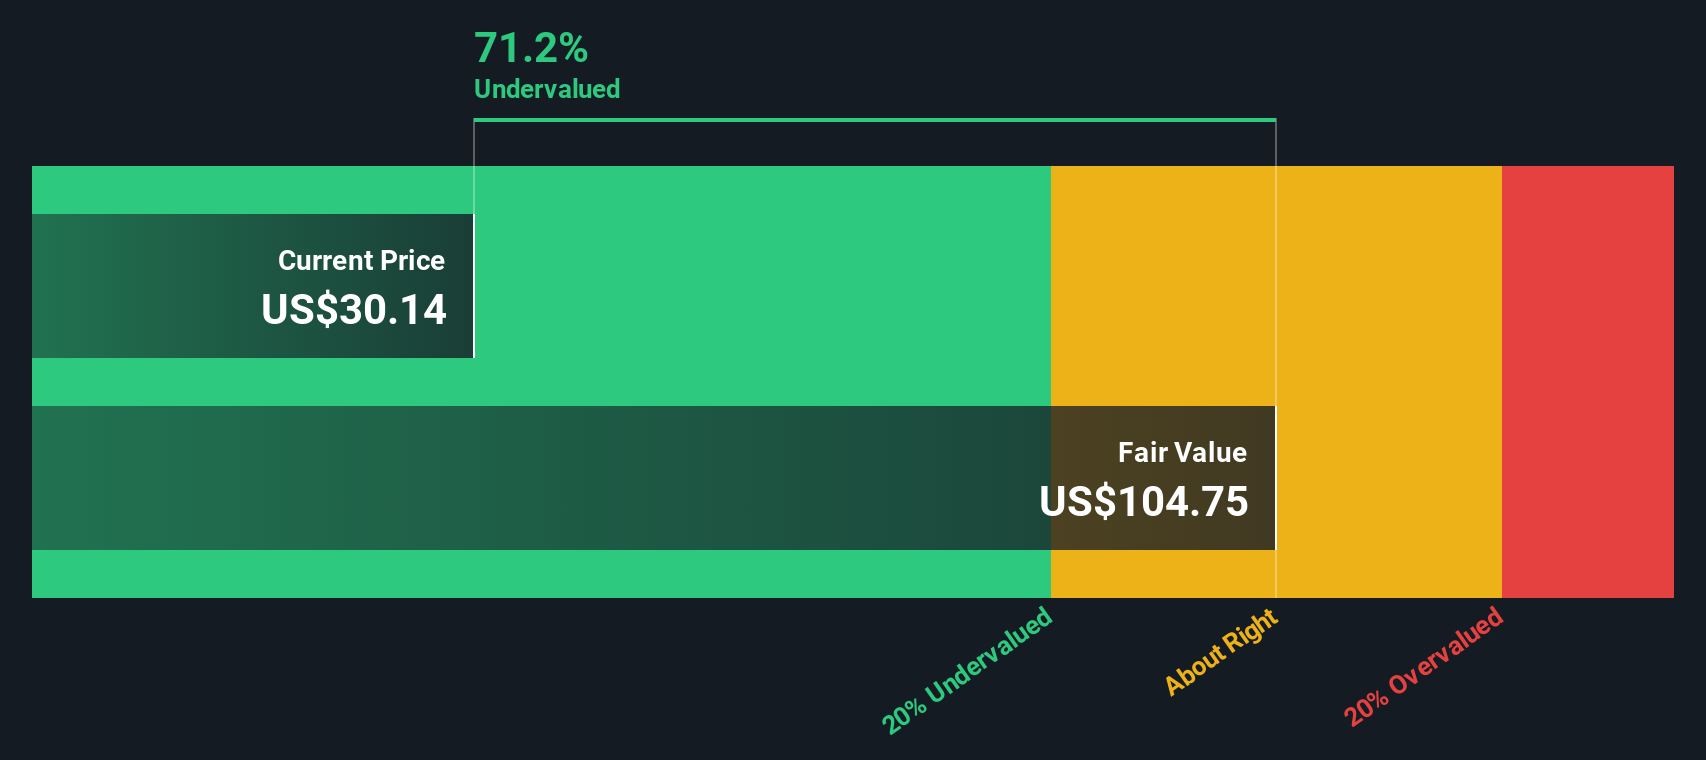
When all those future cash flows are discounted back to today, the model arrives at an intrinsic value of about $93.88 per share. Compared with a market price around $34, the DCF implies the shares are roughly 63.6% undervalued on this cash flow view.
Result: UNDERVALUED
Our Discounted Cash Flow (DCF) analysis suggests DraftKings is undervalued by 63.6%. Track this in your watchlist or portfolio, or discover 909 more undervalued stocks based on cash flows.
Approach 2: DraftKings Price vs Sales
For growth companies that are still normalizing profitability, the price to sales multiple is often the cleanest way to compare valuation, because revenue tends to be more stable and less distorted by heavy marketing and expansion costs than earnings.
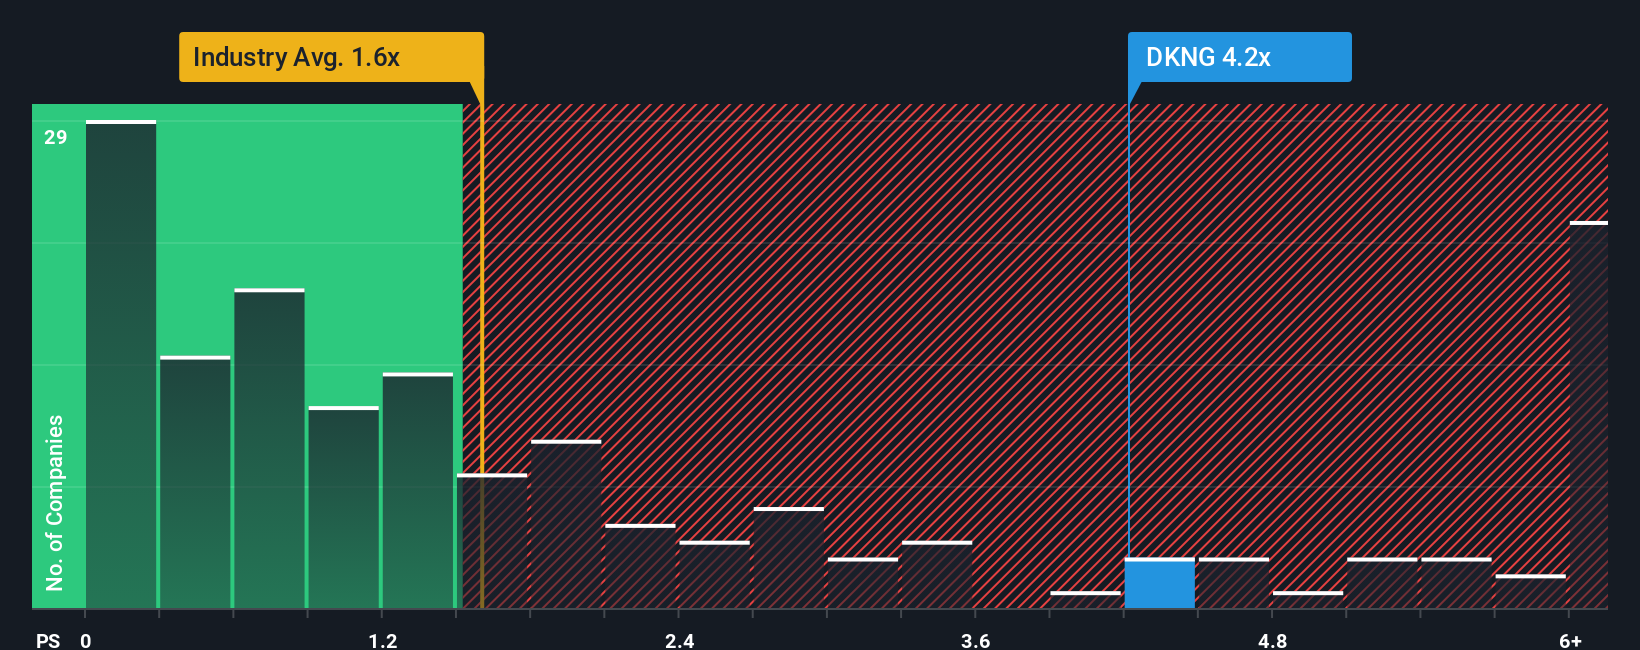
In general, higher expected growth and lower perceived risk justify a higher price to sales ratio, while slower growth or greater uncertainty usually mean investors will only pay a lower multiple. DraftKings currently trades on about 3.12x sales, which is above the Hospitality industry average of roughly 1.67x but not dramatically above the peer group average of about 2.23x.
Simply Wall St also calculates a Fair Ratio of 3.30x for DraftKings, which represents the price to sales multiple you might expect given its specific growth outlook, profitability profile, risk factors, industry positioning and market cap. This comparison can be more informative than a simple peer or industry comparison because it directly adjusts for DraftKings expected growth and risk profile. With the current 3.12x multiple sitting slightly below the 3.30x Fair Ratio, the stock appears modestly undervalued on this metric.
Result: UNDERVALUED
PS ratios tell one story, but what if the real opportunity lies elsewhere? Discover 1460 companies where insiders are betting big on explosive growth.
Upgrade Your Decision Making: Choose your DraftKings Narrative
Earlier we mentioned that there is an even better way to understand valuation, so let us introduce you to Narratives, where you turn your view of DraftKings into a simple story that connects your assumptions about future revenue, earnings and margins to a clear fair value estimate. A Narrative is your own explanation of what you think will happen to the business, tied directly to a financial forecast and then to what you believe the shares are worth, rather than just relying on a single multiple or price target. On Simply Wall St, Narratives are built and shared in the Community page, where millions of investors use them as an easy tool to compare their Fair Value with the current Price and decide whether to buy, hold, or sell. They also update dynamically when new data, news, or earnings arrive, so your story and valuation stay in sync with reality. For example, one DraftKings Narrative might assume expansion into new states supports a fair value near the high analyst target of about $78, while a more cautious Narrative focused on rising taxes and prediction market competition might land closer to the low target around $39.50.
Do you think there's more to the story for DraftKings? Head over to our Community to see what others are saying!
This article by Simply Wall St is general in nature. We provide commentary based on historical data and analyst forecasts only using an unbiased methodology and our articles are not intended to be financial advice. It does not constitute a recommendation to buy or sell any stock, and does not take account of your objectives, or your financial situation. We aim to bring you long-term focused analysis driven by fundamental data. Note that our analysis may not factor in the latest price-sensitive company announcements or qualitative material. Simply Wall St has no position in any stocks mentioned.
Have feedback on this article? Concerned about the content? Get in touch with us directly. Alternatively, email editorial-team@simplywallst.com