
- LIVE QUOTES
- LEARN
- HELP
 Nasdaq
 Wall Street Journal
EN
Dowa Holdings (TSE:5714): Assessing Valuation After Daiwa Upgrade and Top-Gainer Surge on the Nikkei 225
Dowa Holdings (TSE:5714) just surged to the top of the Nikkei 225 leaderboard, climbing about 7% after a bullish reassessment from Daiwa Securities, with the rally reinforced by strength across several key Japanese sectors.
See our latest analysis for Dowa Holdings.
That burst of buying sits on top of an already strong run, with a roughly 14.8% 1 month share price return and a 54.6% year to date share price gain. The 1 year total shareholder return of about 64.3% suggests momentum is still building rather than fading.
If Dowa’s surge has you thinking about what else might be setting up for a strong run, now is a good time to explore fast growing stocks with high insider ownership.
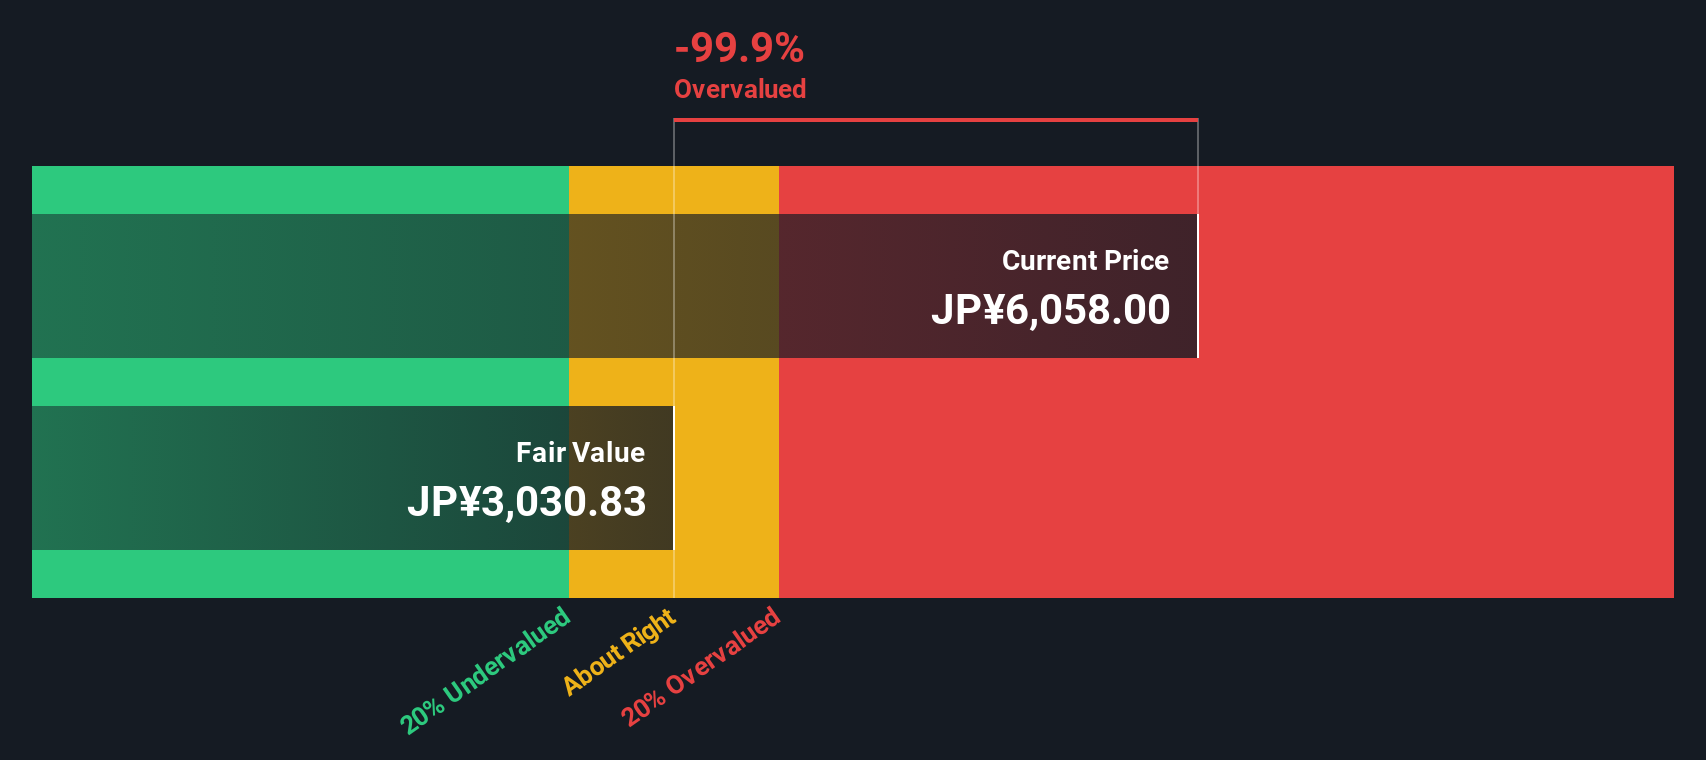
Yet with the shares now trading above analyst targets and after such a powerful run, investors have to ask: is Dowa Holdings still undervalued, or is the market already pricing in all of its future growth?
Price-to-Earnings of 20.2x: Is it justified?
Dowa Holdings is currently trading on a price-to-earnings (P/E) ratio of 20.2 times, with the last close at ¥6,878 and the shares sitting above analyst targets and several intrinsic estimates, suggesting the market is paying up for earnings today.
The P/E multiple compares the company’s share price with its earnings per share, giving investors a quick sense of how much they are paying for each unit of profit. For a diversified materials and recycling group like Dowa, this matters because earnings can be cyclical and heavily influenced by metal prices and one off items.
On one hand, Dowa screens as good value versus its direct peer group, with its 20.2x P/E sitting below the peer average of 22.1x. This hints that investors are not paying a premium relative to similar names. However, against the broader Japanese Metals and Mining industry, where the average P/E is just 12x, Dowa looks materially more expensive. Even relative to an estimated fair P/E of 16.9x, the current multiple implies the market could be overpaying for its earnings power if results normalise.
That gap between a 20.2x trading multiple and a 16.9x fair multiple points to a valuation level the market could eventually gravitate toward if sentiment cools or earnings disappoint.
Explore the SWS fair ratio for Dowa Holdings
Result: Price-to-Earnings of 20.2x (OVERVALUED)
However, sustained outperformance could stall if commodity cycles turn against Dowa or if tightening environmental regulation pushes up compliance and remediation costs.
Find out about the key risks to this Dowa Holdings narrative.
Another Way to Look at Value
Our DCF model paints an even starker picture, with Dowa’s current ¥6,878 share price sitting well above an estimated fair value of roughly ¥635. That wide gap suggests today’s optimism could unwind quickly if growth or margins fall short, or is the market seeing something models cannot?
Look into how the SWS DCF model arrives at its fair value.
Simply Wall St performs a discounted cash flow (DCF) on every stock in the world every day (check out Dowa Holdings for example). We show the entire calculation in full. You can track the result in your watchlist or portfolio and be alerted when this changes, or use our stock screener to discover 913 undervalued stocks based on their cash flows. If you save a screener we even alert you when new companies match - so you never miss a potential opportunity.
Build Your Own Dowa Holdings Narrative
If you see the story differently or want to stress test the numbers yourself, you can build a personalised view in just minutes: Do it your way.
A great starting point for your Dowa Holdings research is our analysis highlighting 1 key reward and 3 important warning signs that could impact your investment decision.
Ready for your next investing move?
Set yourself up for the next opportunity by using the Simply Wall St Screener to pinpoint focused, high conviction ideas before the wider market catches on.
- Secure potentially resilient income streams by targeting companies in these 12 dividend stocks with yields > 3% that may keep paying you even when markets get choppy.
- Ride powerful innovation trends by zeroing in on these 24 AI penny stocks that could benefit as artificial intelligence reshapes entire industries.
- Position ahead of the next digital shift by uncovering ambitious businesses in these 79 cryptocurrency and blockchain stocks pushing blockchain and crypto adoption forward.
This article by Simply Wall St is general in nature. We provide commentary based on historical data and analyst forecasts only using an unbiased methodology and our articles are not intended to be financial advice. It does not constitute a recommendation to buy or sell any stock, and does not take account of your objectives, or your financial situation. We aim to bring you long-term focused analysis driven by fundamental data. Note that our analysis may not factor in the latest price-sensitive company announcements or qualitative material. Simply Wall St has no position in any stocks mentioned.
Have feedback on this article? Concerned about the content? Get in touch with us directly. Alternatively, email editorial-team@simplywallst.com