
- LIVE QUOTES
- LEARN
- HELP
 Nasdaq
 Wall Street Journal
EN
Is Plug Power a Bargain After New Hydrogen Deals and a 93.8% Five Year Slump?
- If you are wondering whether Plug Power at around $2 a share is a beaten-down bargain or a value trap, you are not alone. This is exactly what we are going to unpack.
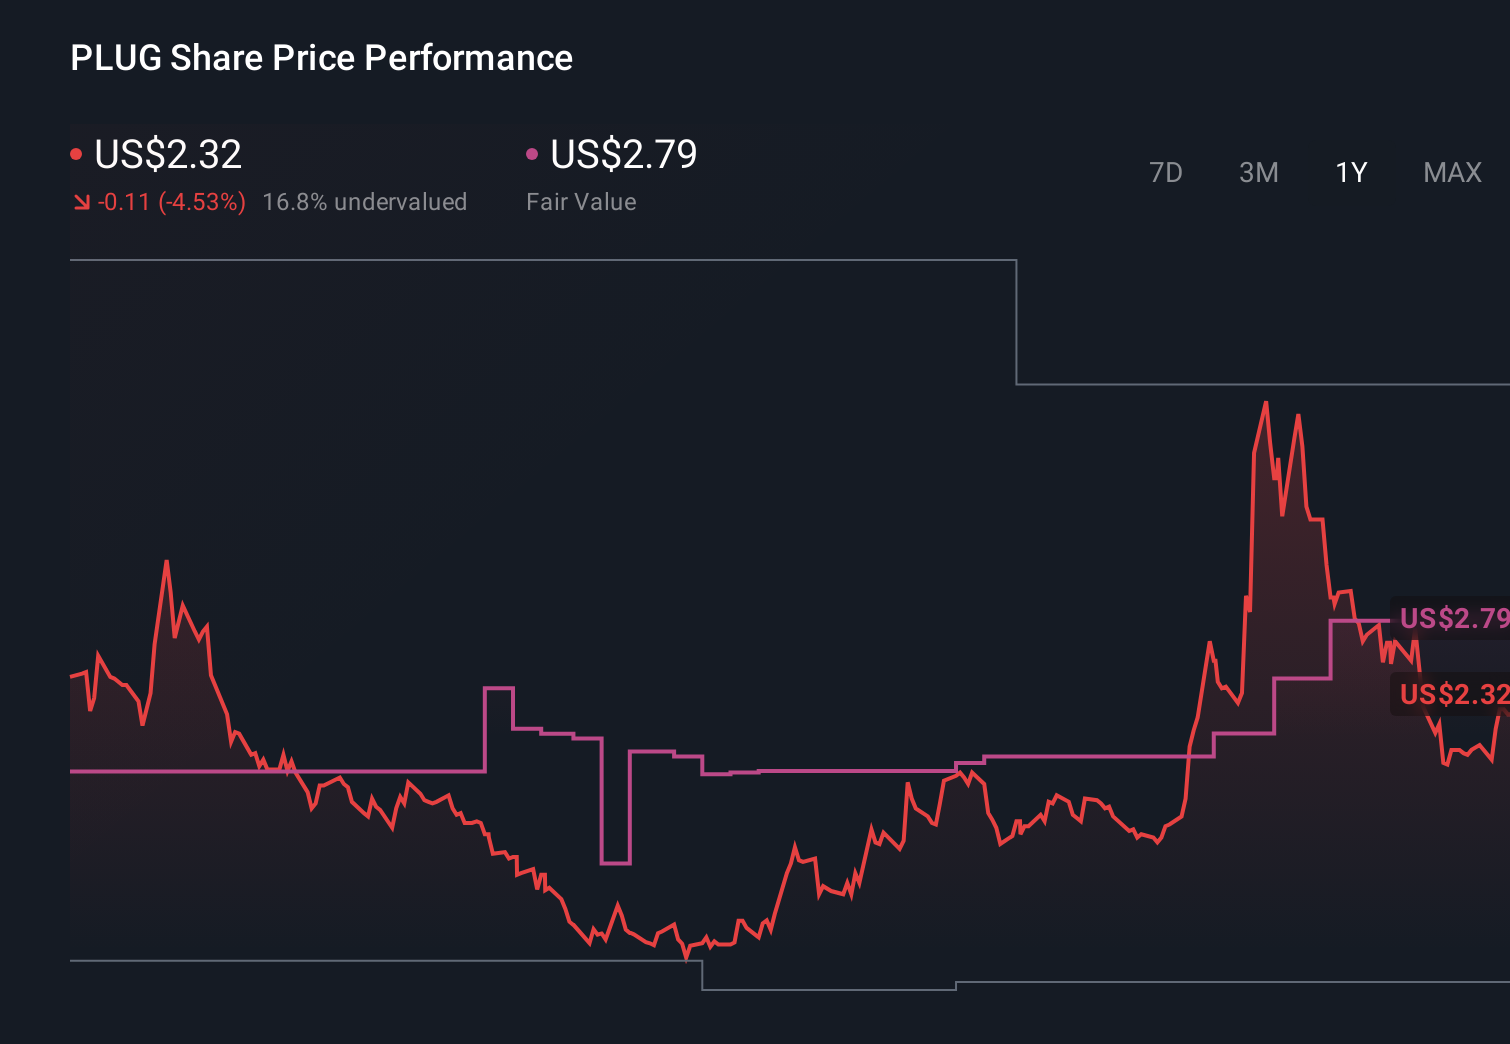
- The stock has bounced about 11.1% over the last month, but it is still down 5.6% year to date and a huge 93.8% over five years. This suggests that sentiment has been on a long, painful slide.
- Recent headlines have focused on Plug Power securing new green hydrogen and fuel cell deployment deals, as well as ongoing funding and partnership efforts that aim to support its ambitious growth plans. At the same time, concerns about the pace of hydrogen adoption and capital needs have kept many investors on the sidelines, which helps explain the volatility behind those recent price moves.
- In our checks, Plug Power scores just 2/6 on valuation, suggesting only a couple of metrics flag it as undervalued right now. Next, we will walk through what different valuation approaches say about the stock and then finish with a more nuanced way to think about its true worth.
Plug Power scores just 2/6 on our valuation checks. See what other red flags we found in the full valuation breakdown.
Approach 1: Plug Power Discounted Cash Flow (DCF) Analysis
A Discounted Cash Flow model estimates what a company is worth by projecting its future cash flows and then discounting them back to today in dollar terms to reflect risk and the time value of money.
For Plug Power, the 2 Stage Free Cash Flow to Equity model starts from a last twelve months free cash flow of about $904 million outflow. Analysts expect cash flows to remain negative in the near term, with around $368 million and $258 million outflows projected for 2026 and 2027, before turning positive. By 2029, free cash flow is projected to reach roughly $257 million, and over a longer horizon, extrapolated estimates move towards more than $1.3 billion by 2035 as the business scales.
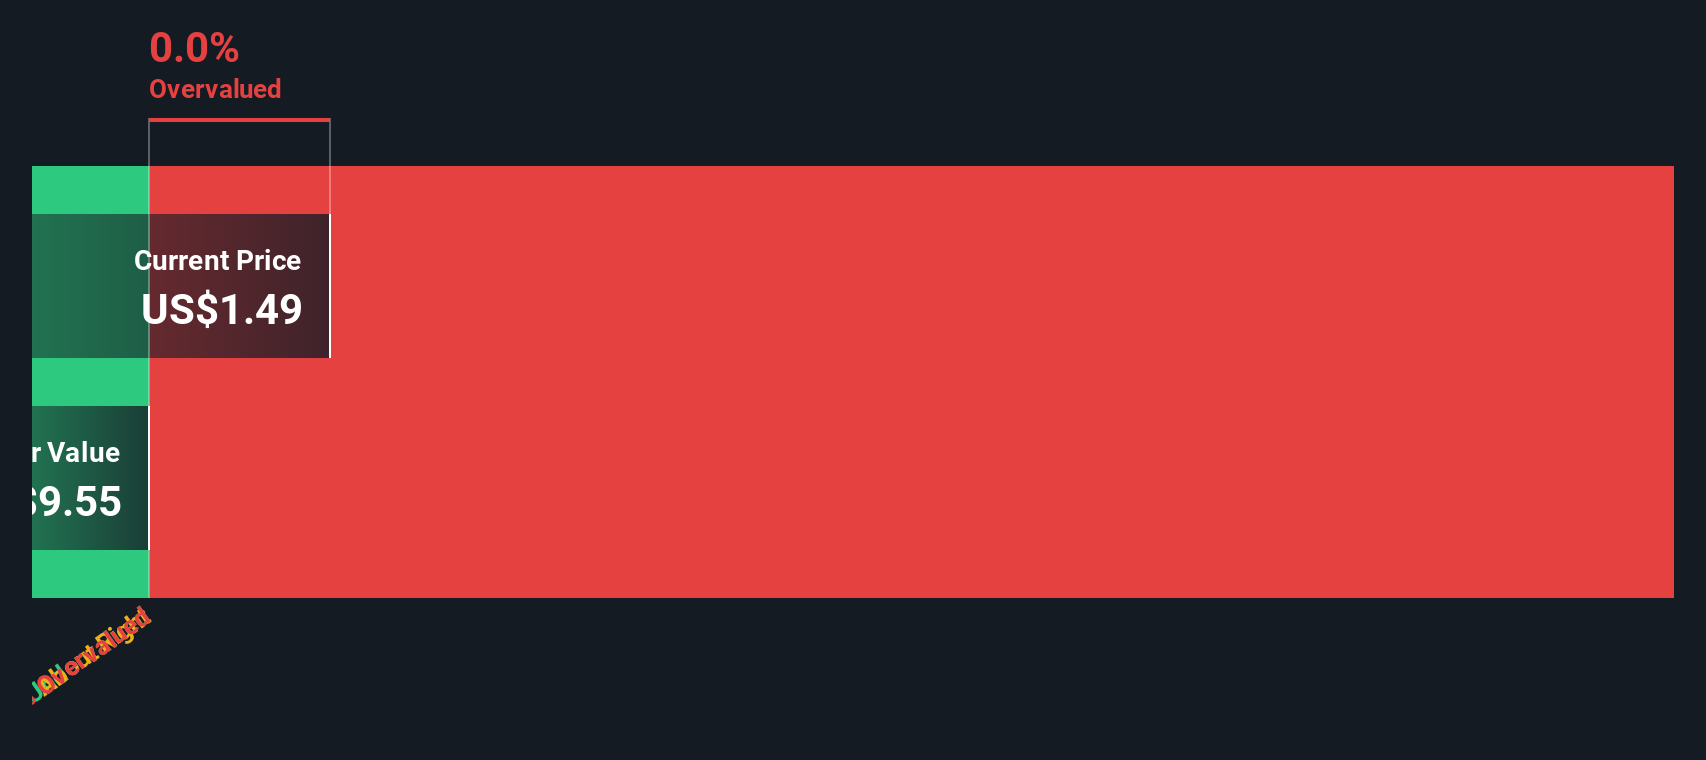
Discounting these projected cash flows back to today produces an estimated intrinsic value of about $7.24 per share. Compared with the current share price of roughly $2, this suggests the stock may be around 69.6% undervalued based on this DCF view.
Result: UNDERVALUED
Our Discounted Cash Flow (DCF) analysis suggests Plug Power is undervalued by 69.6%. Track this in your watchlist or portfolio, or discover 914 more undervalued stocks based on cash flows.
Approach 2: Plug Power Price vs Sales
For companies where profits are still negative or volatile, revenue is often a more stable anchor for valuation, which makes the price to sales ratio a useful yardstick. In general, faster expected growth and lower perceived risk can justify a higher normal price to sales multiple, while slower growth or higher risk should pull that multiple down.
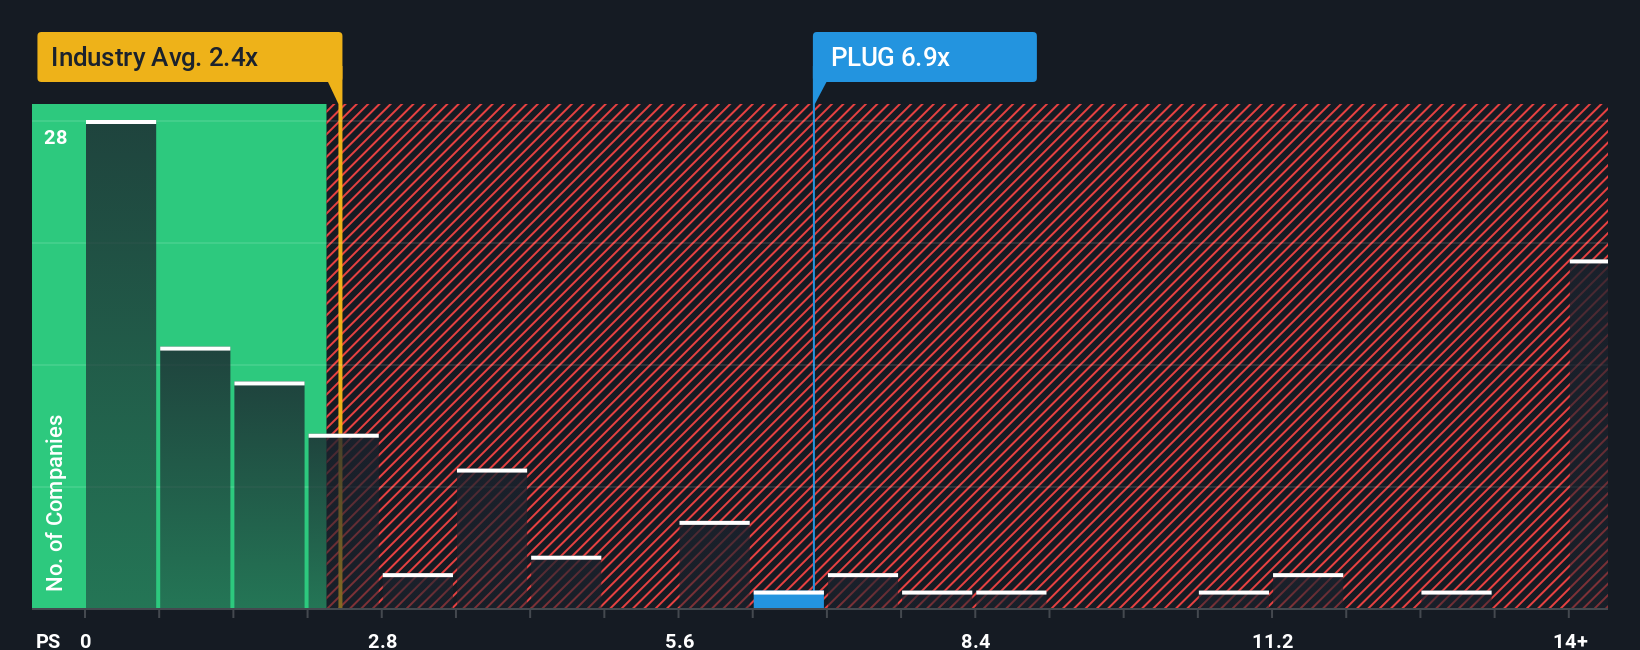
Plug Power currently trades on about 4.47x sales, which is not only above the Electrical industry average of roughly 2.34x, but also higher than the peer group average of around 3.62x. Simply Wall St’s proprietary Fair Ratio model, which blends in factors like Plug Power’s growth outlook, margins, risk profile, industry and market cap, suggests a fair price to sales multiple closer to 0.16x. This Fair Ratio is more informative than simple peer or industry comparisons because it adjusts for the company’s specific fundamentals rather than assuming a one size fits all benchmark. Set against Plug Power’s actual 4.47x sales, that fair value signal points to the shares trading well ahead of where the fundamentals currently justify.
Result: OVERVALUED
PS ratios tell one story, but what if the real opportunity lies elsewhere? Discover 1462 companies where insiders are betting big on explosive growth.
Upgrade Your Decision Making: Choose your Plug Power Narrative
Earlier we mentioned that there is an even better way to understand valuation, so let us introduce you to Narratives, an easy tool on Simply Wall St’s Community page that lets you tell the story behind your numbers by linking your view of Plug Power’s business (its growth drivers, risks and margins) to a structured forecast and a resulting fair value. You can then continuously update that Narrative as new news or earnings arrive, so you can compare your evolving Fair Value to the current share price and decide when to buy or sell. For example, you might lean toward a very optimistic Plug Power Narrative that assumes robust policy support, rising margins and a fair value closer to the top of recent analyst targets around $5.00 per share. Alternatively, you might prefer a far more cautious Narrative that focuses on funding risk, project delays and dilution, and lands nearer the most bearish targets around $0.55. All of this is possible within the same simple, visual framework used by millions of investors on the platform.
Do you think there's more to the story for Plug Power? Head over to our Community to see what others are saying!
This article by Simply Wall St is general in nature. We provide commentary based on historical data and analyst forecasts only using an unbiased methodology and our articles are not intended to be financial advice. It does not constitute a recommendation to buy or sell any stock, and does not take account of your objectives, or your financial situation. We aim to bring you long-term focused analysis driven by fundamental data. Note that our analysis may not factor in the latest price-sensitive company announcements or qualitative material. Simply Wall St has no position in any stocks mentioned.
Have feedback on this article? Concerned about the content? Get in touch with us directly. Alternatively, email editorial-team@simplywallst.com