
- LIVE QUOTES
- LEARN
- HELP
 Nasdaq
 Wall Street Journal
EN
China Shenhua Energy (SEHK:1088): Valuation Check After Mixed November Coal and Chemical Performance Update
China Shenhua Energy (SEHK:1088) just released its November and year to date operating update, with softer coal volumes but stronger polyethylene and polypropylene sales, giving investors a mixed read on the company’s core and chemical businesses.
See our latest analysis for China Shenhua Energy.
The stock has been resilient despite softer coal numbers. The latest HK$39.68 close underpins a 21.9% year to date share price return and a standout 36.9% one year total shareholder return, signalling that long term momentum is still firmly positive.
If China Shenhua’s mix of steady dividends and chemicals growth has your attention, it could be worth discovering fast growing stocks with high insider ownership as you look for the next wave of ideas.
With coal volumes easing, earnings growth modest, and the share price now slightly above consensus targets yet still trading at a hefty intrinsic value discount, is this a late cycle chase or a genuine mispriced growth story?
Price to earnings of 12.8x, is it justified?
On a price to earnings basis, China Shenhua Energy’s 12.8x multiple sits above both peers and its own fair ratio, suggesting a richer valuation at HK$39.68.
The price to earnings ratio compares the current share price to the company’s earnings per share, giving a snapshot of how much investors are willing to pay for each unit of profit. For a mature, cyclical energy and resources group like China Shenhua, this multiple often reflects expectations around commodity cycles, power demand, and the durability of its coal and infrastructure cash flows.
At 12.8x earnings, the stock trades above the estimated fair price to earnings ratio of 12.1x, implying the market is assigning a premium to its current profit base rather than discounting it. That stands out even more when set against the Hong Kong Oil and Gas industry average of 9.1x and a peer average of 9.3x, a clear signal that investors are paying up relative to sector norms and where the market could ultimately gravitate if sentiment cools.
Explore the SWS fair ratio for China Shenhua Energy
Result: Price-to-earnings of 12.8x (OVERVALUED)
However, earnings could disappoint if coal volumes keep softening or chemical margins compress, especially with shares trading slightly above consensus price targets.
Find out about the key risks to this China Shenhua Energy narrative.
Another View: Our DCF Model Points to Deep Value
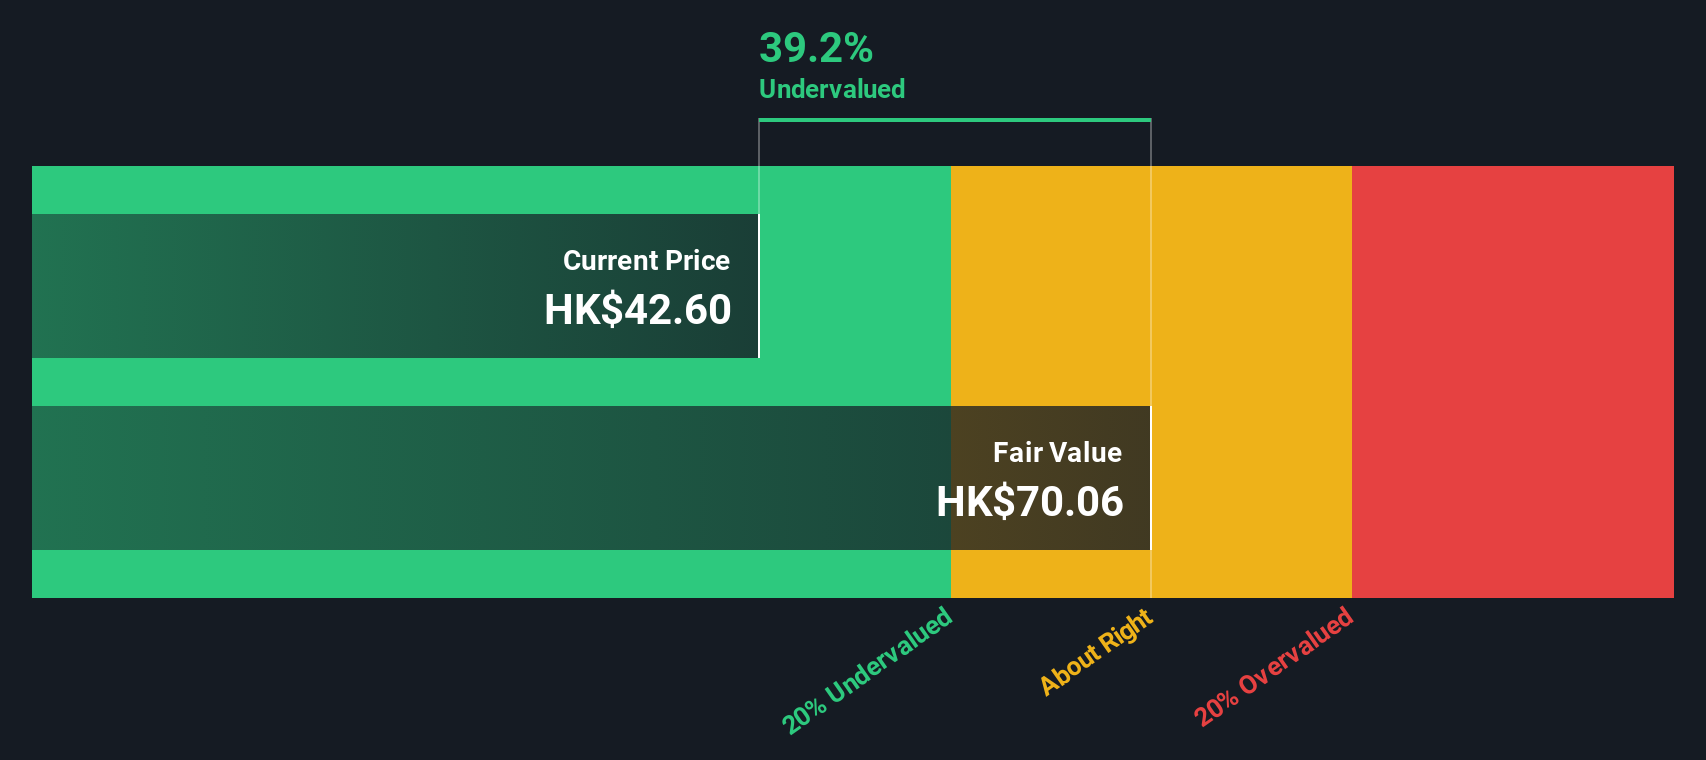
While the price to earnings ratio hints at a rich valuation, our DCF model paints a very different picture, suggesting China Shenhua is trading around 44% below fair value at roughly HK$70.96 per share. If the cash flows hold up, could sentiment be underpricing a slower growth, high cash generator?
Look into how the SWS DCF model arrives at its fair value.
Simply Wall St performs a discounted cash flow (DCF) on every stock in the world every day (check out China Shenhua Energy for example). We show the entire calculation in full. You can track the result in your watchlist or portfolio and be alerted when this changes, or use our stock screener to discover 914 undervalued stocks based on their cash flows. If you save a screener we even alert you when new companies match - so you never miss a potential opportunity.
Build Your Own China Shenhua Energy Narrative
If you see things differently, or prefer to dig through the numbers yourself, you can build a personalised view in just minutes: Do it your way.
A great starting point for your China Shenhua Energy research is our analysis highlighting 1 key reward and 2 important warning signs that could impact your investment decision.
Looking for your next investing move?
Before you move on, lock in an edge by scanning fresh ideas with the Simply Wall St Screener, so the next opportunity does not slip past you.
- Capture potential high-upside movers early by targeting these 3634 penny stocks with strong financials that already show resilient balance sheets and improving fundamentals.
- Position your portfolio for structural growth by focusing on these 29 healthcare AI stocks at the intersection of medical innovation and intelligent software.
- Strengthen your income stream by hunting for these 12 dividend stocks with yields > 3% that can support reliable cash returns through changing market cycles.
This article by Simply Wall St is general in nature. We provide commentary based on historical data and analyst forecasts only using an unbiased methodology and our articles are not intended to be financial advice. It does not constitute a recommendation to buy or sell any stock, and does not take account of your objectives, or your financial situation. We aim to bring you long-term focused analysis driven by fundamental data. Note that our analysis may not factor in the latest price-sensitive company announcements or qualitative material. Simply Wall St has no position in any stocks mentioned.
Have feedback on this article? Concerned about the content? Get in touch with us directly. Alternatively, email editorial-team@simplywallst.com