
- LIVE QUOTES
- LEARN
- HELP
 Nasdaq
 Wall Street Journal
EN
Does Paramount Skydance’s 2025 Rebound Signal a Hidden Opportunity at $13?
- Wondering if Paramount Skydance at around $13 a share is a bargain in disguise or a value trap? You are not alone, and that is exactly what we are going to unpack.
- The stock is up about 23.3% year to date and 23.7% over the last year, even after a recent pullback of 5.0% over the past week and 15.6% over the last month. This hints that investors are still recalibrating how risky or promising the story really is.
- Much of the recent share price action has been driven by renewed attention on Paramount Skydance as a combined media and content powerhouse. Investors are debating how its film slate, streaming ambitions, and strategic partnerships could reshape long term cash flows. At the same time, sector wide shifts in advertising, streaming profitability, and content spending have put a spotlight on which media names are genuinely undervalued versus those just riding sentiment.
- On our checks, Paramount Skydance scores a strong 5/6 valuation score, suggesting the market may still be underestimating its fundamentals. Next we will walk through the key valuation approaches, before finishing with an even better way to think about what this number really means for long term investors.
Approach 1: Paramount Skydance Discounted Cash Flow (DCF) Analysis
A Discounted Cash Flow model estimates what a company is worth today by projecting the cash it could generate in the future and discounting those cash flows back to the present. For Paramount Skydance, the model used is a 2 Stage Free Cash Flow to Equity approach, based on cash flow projections in $.
The company currently generates about $305 Million in Free Cash Flow, with analyst forecasts and extrapolations pointing to roughly $944 Million by 2029 and more than $1.4 Billion by 2034. Early years include a dip in 2026, followed by recovering and steadily growing cash flows, which suggests a rebuilding phase before more durable growth.
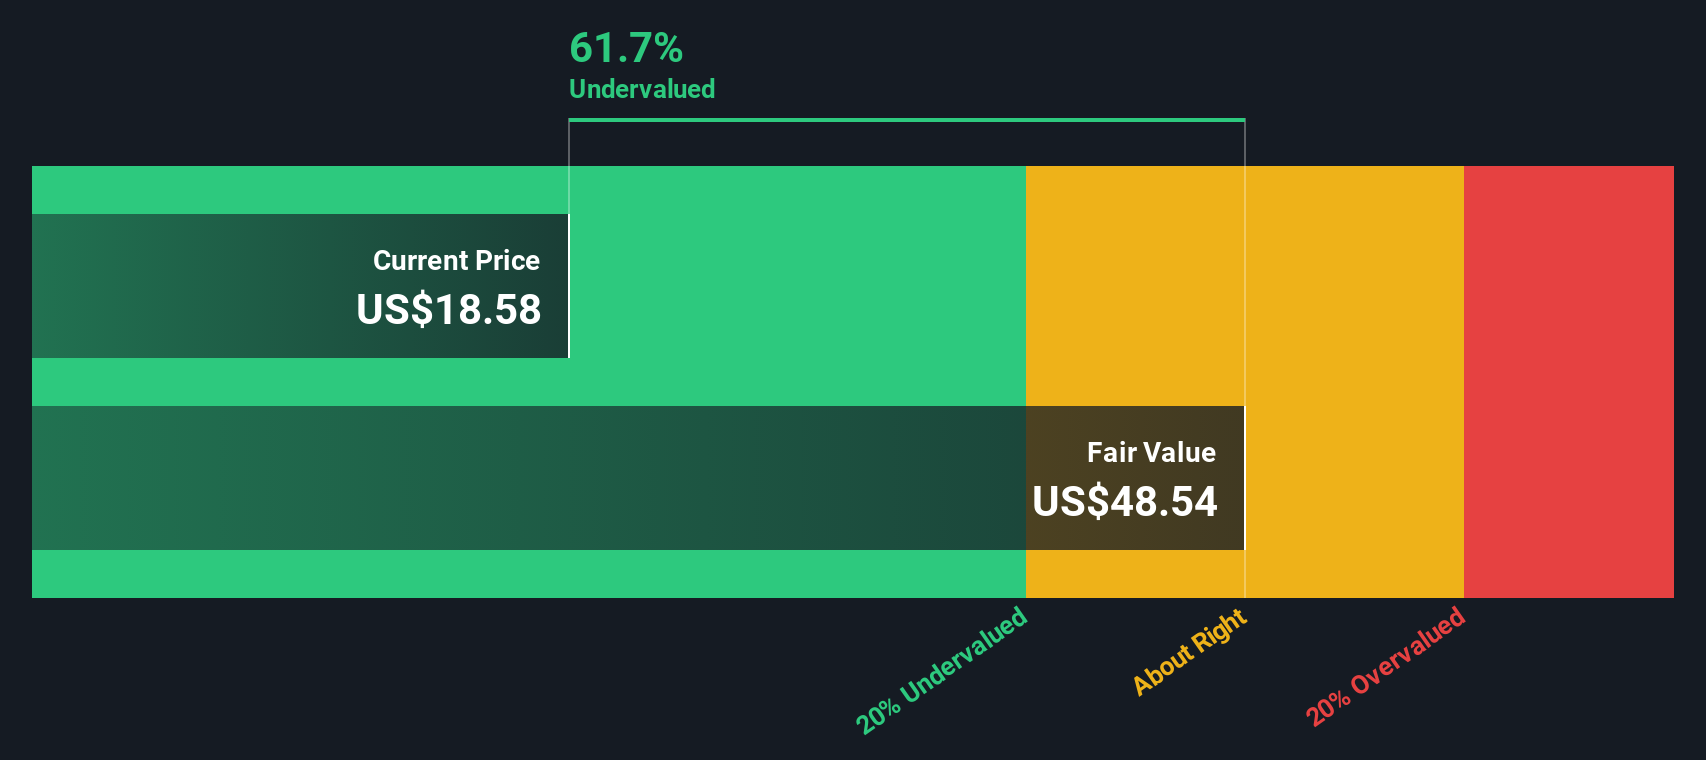
When these projected cash flows are discounted back using Simply Wall St assumptions, the model arrives at an intrinsic value of about $18.12 per share. Compared with the current share price around $13, the DCF implies the stock is roughly 28.0% undervalued, indicating that the market may be pricing in more risk than the cash flow outlook justifies.
Result: UNDERVALUED
Our Discounted Cash Flow (DCF) analysis suggests Paramount Skydance is undervalued by 28.0%. Track this in your watchlist or portfolio, or discover 913 more undervalued stocks based on cash flows.
Approach 2: Paramount Skydance Price vs Sales
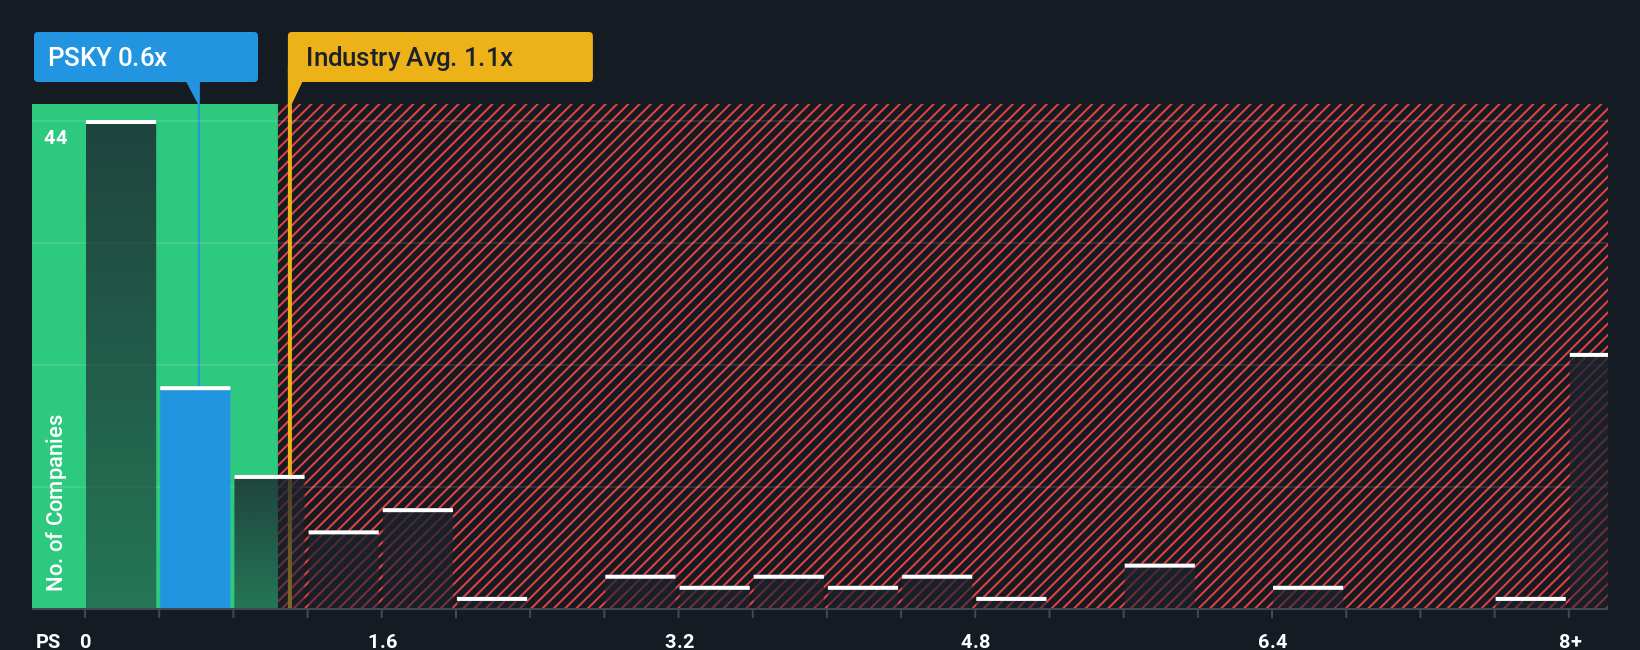
For media companies where earnings can be noisy due to heavy content investment, the Price to Sales ratio is often a cleaner way to gauge value, because revenue tends to be more stable and less affected by accounting swings. In general, higher growth and lower perceived risk justify a higher normal multiple, while slower growth or greater uncertainty call for a discount.
Paramount Skydance currently trades at about 0.50x sales, which is below both the wider Media industry average of roughly 0.98x and the peer group average of around 1.13x. Simply Wall St goes a step further with its proprietary Fair Ratio, which estimates what a reasonable Price to Sales multiple should be given the company’s specific growth outlook, profitability, industry positioning, size, and risk profile. For Paramount Skydance, that Fair Ratio is 1.44x. This suggests the stock appears significantly cheaper than what its fundamentals would typically warrant, even after adjusting for risks and sector dynamics.
Result: UNDERVALUED
PS ratios tell one story, but what if the real opportunity lies elsewhere? Discover 1463 companies where insiders are betting big on explosive growth.
Upgrade Your Decision Making: Choose your Paramount Skydance Narrative
Earlier we mentioned that there is an even better way to understand valuation, so let us introduce you to Narratives, a simple way to connect your view of Paramount Skydance’s future with the numbers behind it. A Narrative is the story you believe about a company, translated into assumptions about its future revenue growth, profit margins, and risk, which then flow into a financial forecast and ultimately a fair value estimate. On Simply Wall St’s Community page, used by millions of investors, Narratives are an accessible tool that let you quickly see how your story compares with others and with the current share price, so you can decide whether Paramount Skydance looks like a buy, hold, or sell. They also update dynamically as new information, such as earnings or major news, comes in, so your view and fair value do not go stale. For example, one Paramount Skydance Narrative might assume strong streaming gains and assign a much higher fair value than another Narrative that expects shrinking advertising and slower content monetization.
Do you think there's more to the story for Paramount Skydance? Head over to our Community to see what others are saying!

This article by Simply Wall St is general in nature. We provide commentary based on historical data and analyst forecasts only using an unbiased methodology and our articles are not intended to be financial advice. It does not constitute a recommendation to buy or sell any stock, and does not take account of your objectives, or your financial situation. We aim to bring you long-term focused analysis driven by fundamental data. Note that our analysis may not factor in the latest price-sensitive company announcements or qualitative material. Simply Wall St has no position in any stocks mentioned.
Have feedback on this article? Concerned about the content? Get in touch with us directly. Alternatively, email editorial-team@simplywallst.com