
- LIVE QUOTES
- LEARN
- HELP
 Nasdaq
 Wall Street Journal
EN
Assessing Southern’s Valuation After Grid Investments and Long Term Cash Flow Outlook
- If you are wondering whether Southern is still a sensible buy at around $85 a share, or if the best gains are already behind it, this is the right place to unpack what the current price really implies.
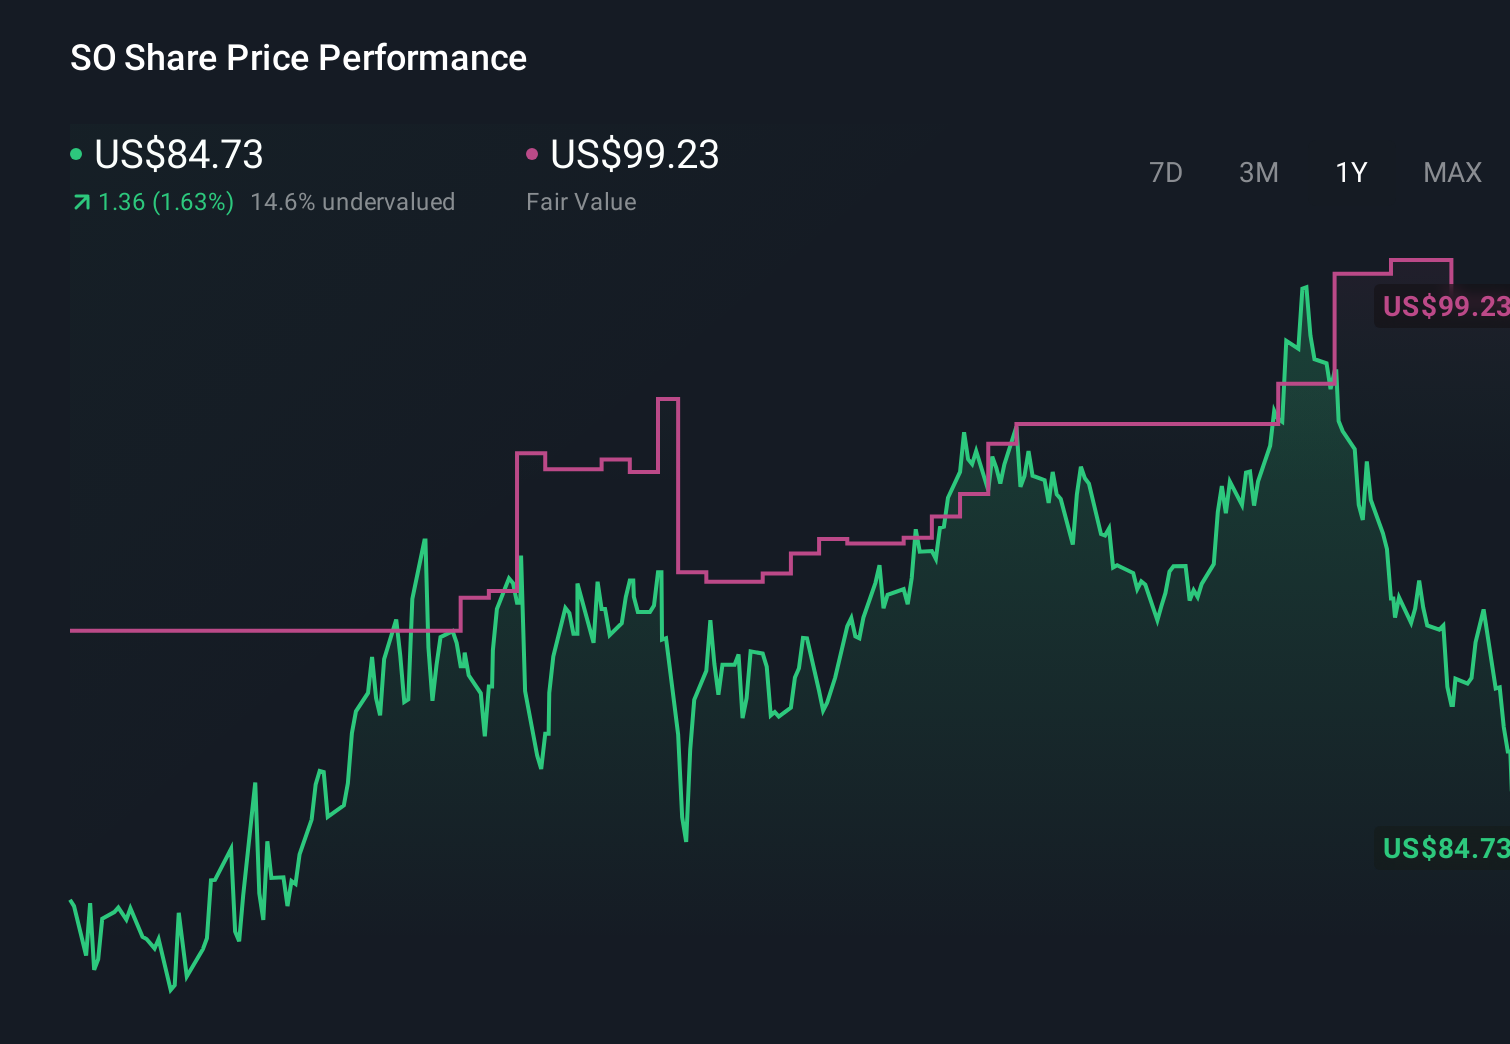
- Despite some recent choppiness, with the stock up 1.0% over the last week but down 4.2% over the past 30 days, Southern still sits modestly ahead year to date at 3.9%, with a 6.4% 1-year return and 32.6% and 72.3% gains over 3 and 5 years respectively.
- Recent headlines have focused on Southern's progress bringing new generation capacity online and ongoing investments in grid reliability, which have helped shape investor expectations around long-term earnings stability. At the same time, regulatory updates and policy moves affecting US utilities have kept risk perception in flux, adding nuance to how the market prices Southern today.
- Right now, Southern scores a 4/6 valuation check, which suggests the market may be underestimating its value by several measures. Next, we will look at the main valuation approaches investors use, before finishing with a more powerful way to put all those methods into context.
Find out why Southern's 6.4% return over the last year is lagging behind its peers.
Approach 1: Southern Discounted Cash Flow (DCF) Analysis
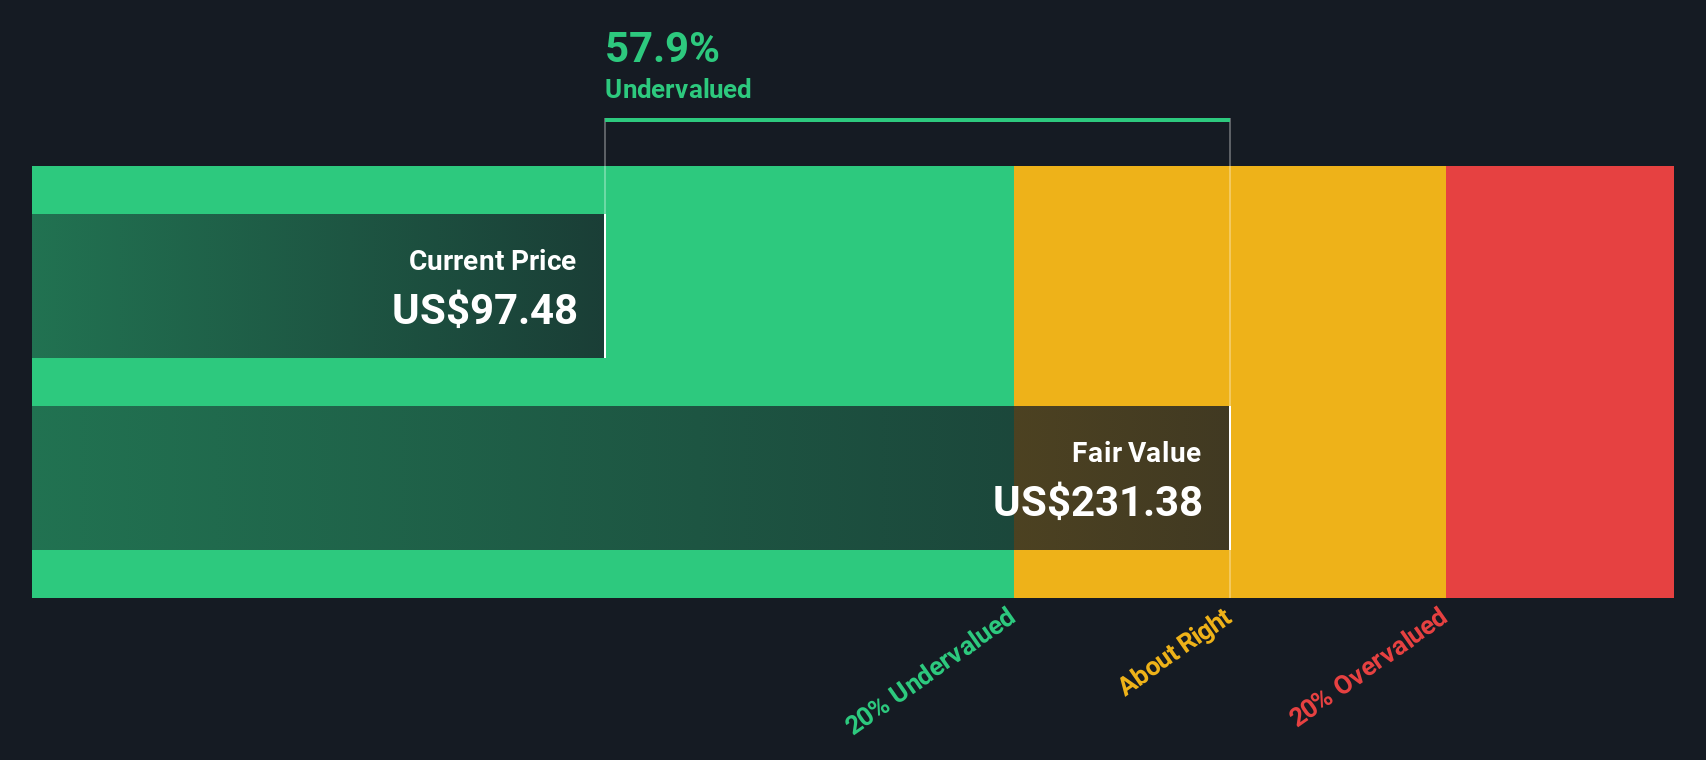
A Discounted Cash Flow model estimates what a company is worth today by projecting the cash it can generate in the future and discounting those amounts back to a present value. For Southern, the latest twelve month Free Cash Flow is negative at around $1.0 billion, reflecting heavy investment and timing effects in the utility business.
Analysts currently project Free Cash Flow of about $592 million in 2026 and $2.16 billion by 2027, with Simply Wall St extrapolating this out to roughly $17.2 billion of Free Cash Flow by 2035 as new assets come online and cash generation scales. Discounting this stream of cash flows using a 2 Stage Free Cash Flow to Equity approach produces an estimated intrinsic value of about $259 per share.
Compared with a share price near $85, the DCF output implies the stock is roughly 67.1% undervalued, indicating that the market may be heavily discounting these long term cash flow projections.
Result: UNDERVALUED (based on this DCF model)
Our Discounted Cash Flow (DCF) analysis suggests Southern is undervalued by 67.1%. Track this in your watchlist or portfolio, or discover 914 more undervalued stocks based on cash flows.
Approach 2: Southern Price vs Earnings
For profitable companies like Southern, the Price to Earnings, or PE, ratio is often the most intuitive way to think about value, because it links what investors pay directly to the earnings the business is generating today.
A higher PE can be justified when investors expect faster earnings growth or see the company as relatively low risk, while slower growth or elevated risk usually calls for a lower, more conservative multiple. Southern currently trades on a PE of about 21.1x, which is above the Electric Utilities industry average of roughly 19.4x but below the broader peer group average near 25.2x.
Simply Wall St’s proprietary Fair Ratio estimate for Southern is around 25.2x. This Fair Ratio represents the PE one might expect given the company’s specific earnings growth outlook, profit margins, size, industry positioning, and risk profile. Because it is tailored to Southern’s fundamentals rather than just broad sector averages, it provides a more nuanced benchmark than simple peer or industry comparisons. With the stock trading on 21.1x versus a Fair Ratio of 25.2x, Southern appears modestly undervalued on a PE basis.
Result: UNDERVALUED
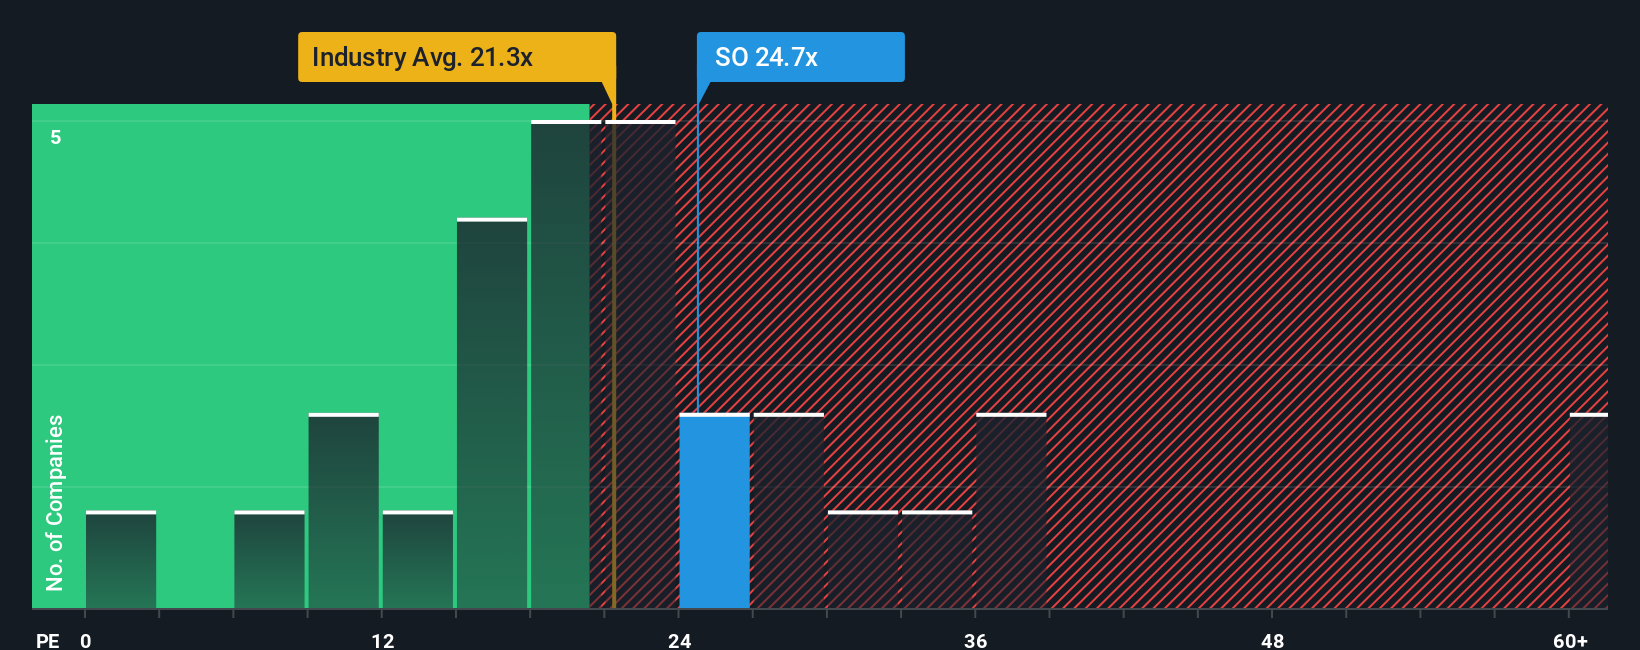
PE ratios tell one story, but what if the real opportunity lies elsewhere? Discover 1466 companies where insiders are betting big on explosive growth.
Upgrade Your Decision Making: Choose your Southern Narrative
Earlier we mentioned that there is an even better way to understand valuation, so let us introduce you to Narratives, a simple way to attach your story about Southern’s future to the numbers behind its fair value. A Narrative is your view of how the business will grow, what its revenues, earnings and margins might look like, and what risks matter most, all translated into a financial forecast and then into a fair value estimate. On Simply Wall St’s Community page, used by millions of investors, Narratives make this process accessible by letting you compare your own fair value to the current share price so you can decide whether Southern looks like a buy, a hold, or a sell. Because Narratives update dynamically as new earnings, news and regulatory developments arrive, they stay aligned with what is really happening. For example, one Southern investor might build a bullish Narrative close to the $108 fair value implied by strong long term growth and clean energy investment, while another might lean toward a more cautious $75 view that emphasizes regulatory, cost and dilution risks.
Do you think there's more to the story for Southern? Head over to our Community to see what others are saying!
This article by Simply Wall St is general in nature. We provide commentary based on historical data and analyst forecasts only using an unbiased methodology and our articles are not intended to be financial advice. It does not constitute a recommendation to buy or sell any stock, and does not take account of your objectives, or your financial situation. We aim to bring you long-term focused analysis driven by fundamental data. Note that our analysis may not factor in the latest price-sensitive company announcements or qualitative material. Simply Wall St has no position in any stocks mentioned.
Have feedback on this article? Concerned about the content? Get in touch with us directly. Alternatively, email editorial-team@simplywallst.com