
- LIVE QUOTES
- LEARN
- HELP
 Nasdaq
 Wall Street Journal
EN
How Ryder’s 241% Five Year Surge Shapes the Current Valuation Debate
- If you are looking at Ryder System and wondering whether the recent run means you are late to the party, you are not alone. This stock has quietly become one of the more interesting value debates in transportation.
- Ryder shares now trade around $191.56 after rising 1.1% over the last week, 14.9% over the past month, 22.4% year to date, 25.6% in the last year, and 241.1% over five years. That naturally raises the question of how much upside might be left relative to the risks.
- Much of that strength has been underpinned by ongoing interest in logistics and supply chain resilience, as investors look for companies that can benefit from reshoring and tighter freight markets. At the same time, Ryder has been reshaping its business mix toward more integrated logistics and higher value services, which helps explain why market sentiment has turned more constructive.
- Even after that run, Ryder posts a valuation score of 4/6, suggesting it still screens as undervalued on most of the checks we use. Next, we will unpack what different valuation methods say about that number, before circling back at the end to a more holistic way of thinking about Ryder's true worth.
Approach 1: Ryder System Discounted Cash Flow (DCF) Analysis
A Discounted Cash Flow, or DCF, model estimates what a business is worth today by projecting the cash it can generate in the future and discounting those cash flows back to their present value. For Ryder System, the model used is a 2 Stage Free Cash Flow to Equity approach, which starts with near term forecasts and then tapers growth over time.
Ryder’s last twelve month Free Cash Flow stands at about $195.4 Million, and analysts, plus Simply Wall St’s extrapolations, see this climbing materially over the coming decade. For example, projected Free Cash Flow for 2026 is around $898.3 Million, with longer term estimates continuing to rise as the business scales its logistics and higher value services platform.
Discounting these cash flows back to today results in an estimated intrinsic value of roughly $1,322.5 per share. Compared with the current share price near $191.56, the DCF implies Ryder is about 85.5% undervalued. This suggests the market is heavily discounting its long term cash generation potential.
Result: UNDERVALUED
Our Discounted Cash Flow (DCF) analysis suggests Ryder System is undervalued by 85.5%. Track this in your watchlist or portfolio, or discover 914 more undervalued stocks based on cash flows.
Approach 2: Ryder System Price vs Earnings
For a consistently profitable business like Ryder, the price to earnings, or PE, ratio is a sensible way to gauge value because it directly compares what investors are paying with what the company is currently earning. In general, faster growth and lower perceived risk justify a higher PE, while slower growth or greater risk call for a lower, more conservative multiple.
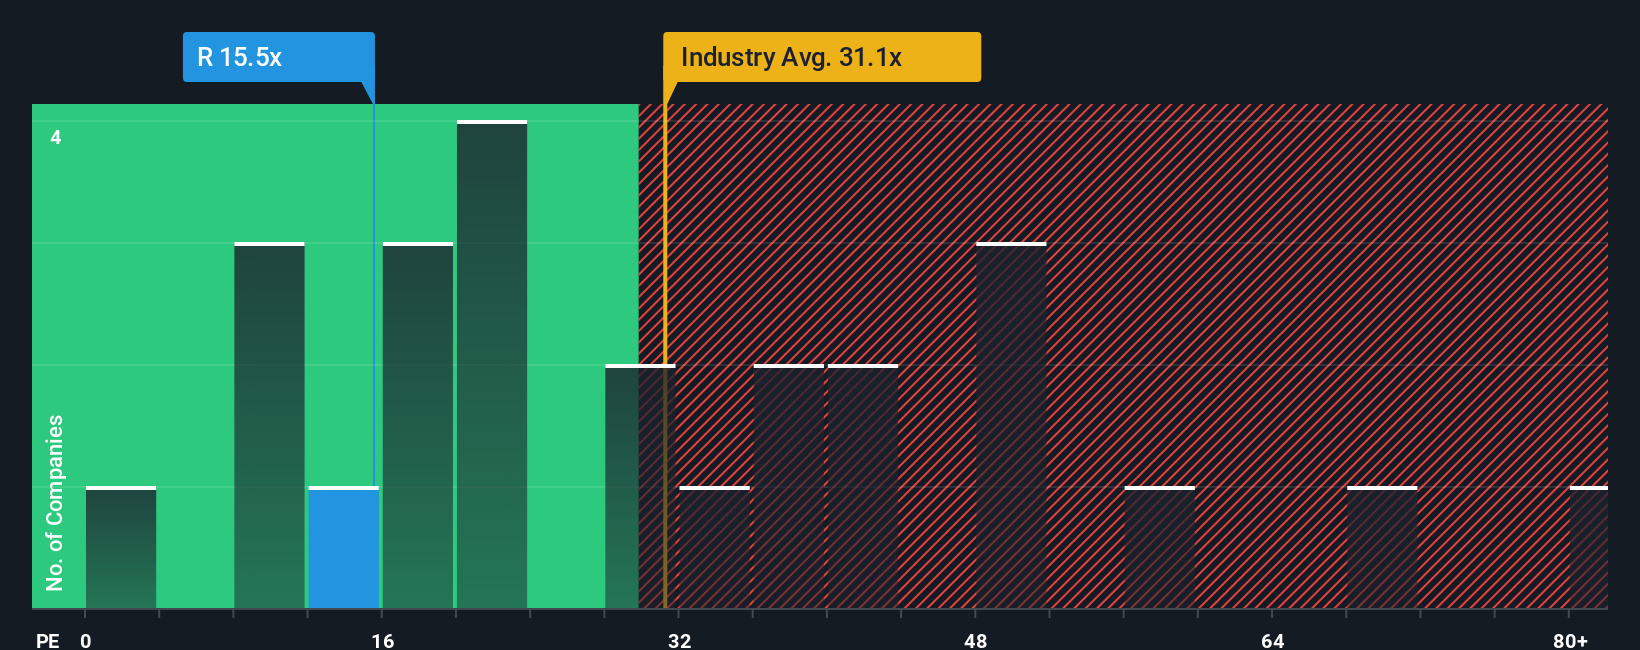
Ryder currently trades on a PE of about 15.47x, which is well below both the Transportation industry average of roughly 31.12x and the broader peer group average of about 43.69x. To move beyond simple comparisons, Simply Wall St uses a proprietary “Fair Ratio” that estimates what PE Ryder should trade on given its earnings growth outlook, profitability, industry, market cap, and risk profile.
On this basis, Ryder’s Fair Ratio comes out at around 14.85x, slightly below the current 15.47x but still in the same ballpark. Because this framework adjusts for the company’s own fundamentals rather than relying purely on broad industry or peer averages, it offers a more tailored view of fair value. With the actual PE only modestly above the Fair Ratio, the stock screens as mildly expensive rather than outright cheap.
Result: OVERVALUED
PE ratios tell one story, but what if the real opportunity lies elsewhere? Discover 1466 companies where insiders are betting big on explosive growth.
Upgrade Your Decision Making: Choose your Ryder System Narrative
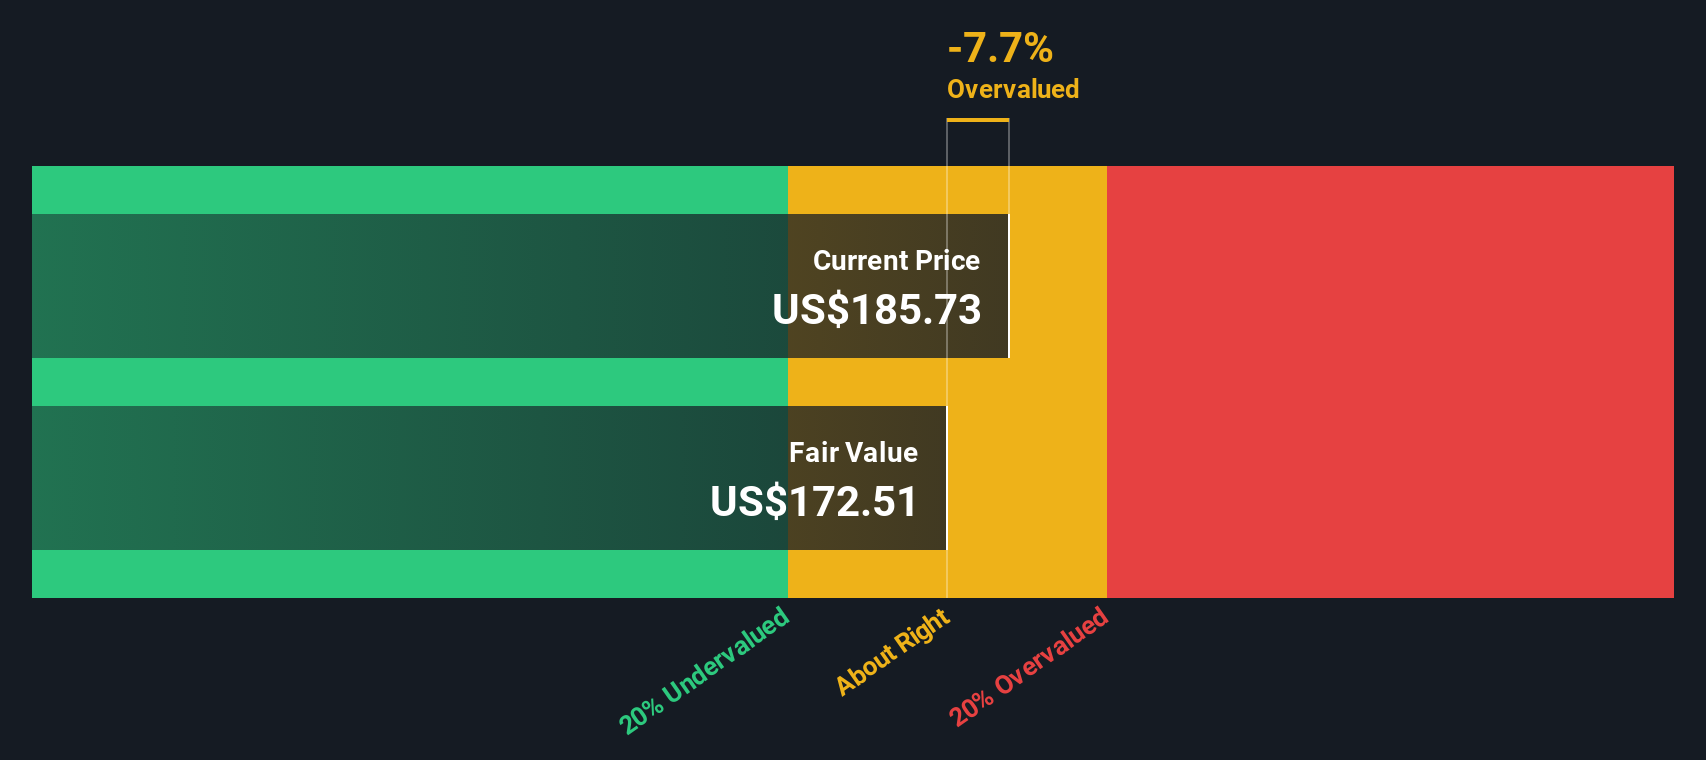
Earlier we mentioned that there is an even better way to understand valuation, so let us introduce you to Narratives, a simple way to connect your view of Ryder System’s story with a concrete financial forecast and a Fair Value estimate on Simply Wall St’s Community page. A Narrative is your own, easy to build storyline for a company. You spell out what you think will happen to revenue, earnings and margins, and the platform automatically turns that story into forecasts and a Fair Value that you can compare with today’s share price to inform your decision to buy, hold or sell. Because Narratives live on the platform used by millions of investors, they update dynamically as new information such as earnings, guidance or news comes in. This helps your Fair Value stay anchored in the latest data rather than a static spreadsheet. For example, one Ryder Narrative might assume re-shoring, contract growth and buybacks justify a Fair Value near $215 per share, while another more cautious view might focus on freight weakness and competition to support a Fair Value closer to $183. The spread between those views shows how much your story really matters.
Do you think there's more to the story for Ryder System? Head over to our Community to see what others are saying!

This article by Simply Wall St is general in nature. We provide commentary based on historical data and analyst forecasts only using an unbiased methodology and our articles are not intended to be financial advice. It does not constitute a recommendation to buy or sell any stock, and does not take account of your objectives, or your financial situation. We aim to bring you long-term focused analysis driven by fundamental data. Note that our analysis may not factor in the latest price-sensitive company announcements or qualitative material. Simply Wall St has no position in any stocks mentioned.
Have feedback on this article? Concerned about the content? Get in touch with us directly. Alternatively, email editorial-team@simplywallst.com