
- LIVE QUOTES
- LEARN
- HELP
 Nasdaq
 Wall Street Journal
EN
Michang Oil Ind. Co., Ltd.'s (KRX:003650) most bullish insider is CEO Jae-Soon Yoo, and their holdings value went up by 11% last week
Key Insights
- Significant insider control over Michang Oil Ind implies vested interests in company growth
- A total of 2 investors have a majority stake in the company with 58% ownership
- Institutional ownership in Michang Oil Ind is 14%
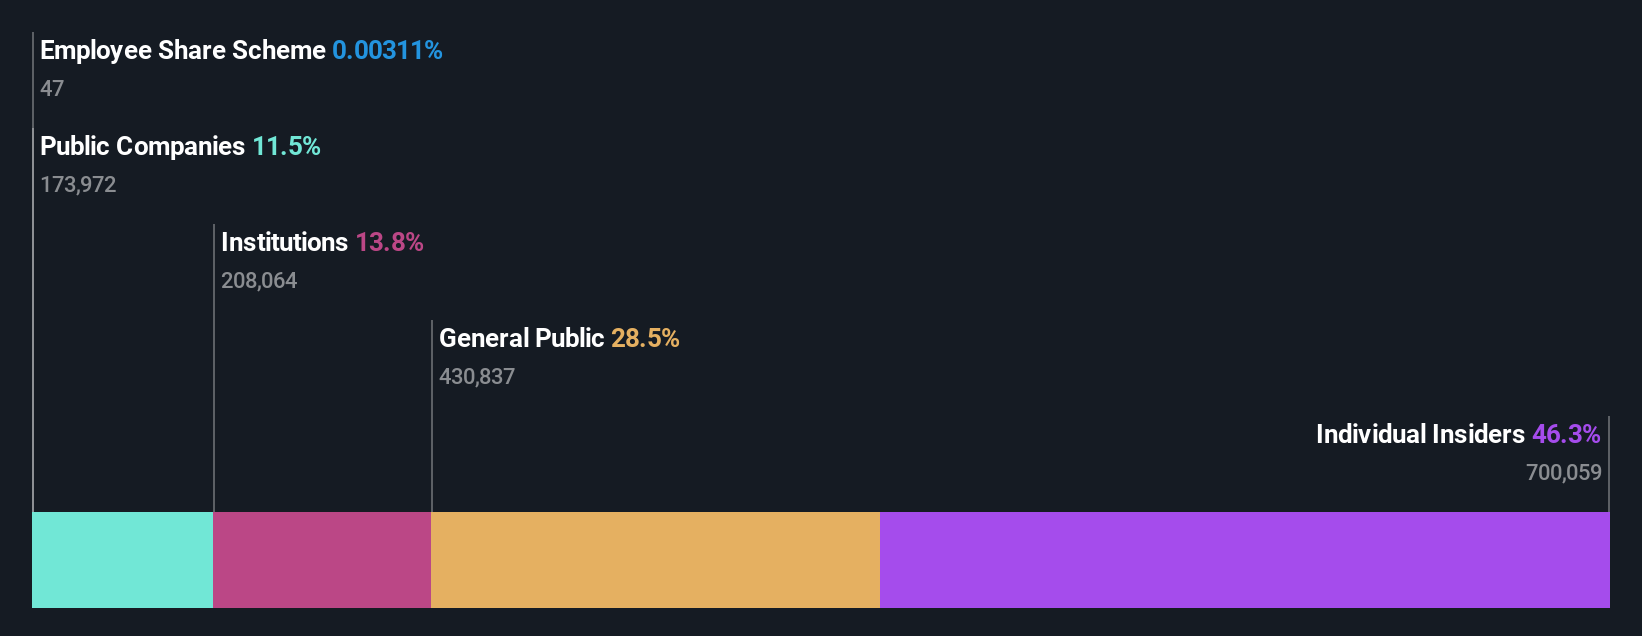
If you want to know who really controls Michang Oil Ind. Co., Ltd. (KRX:003650), then you'll have to look at the makeup of its share registry. With 46% stake, individual insiders possess the maximum shares in the company. In other words, the group stands to gain the most (or lose the most) from their investment into the company.
As a result, insiders scored the highest last week as the company hit ₩190b market cap following a 11% gain in the stock.
In the chart below, we zoom in on the different ownership groups of Michang Oil Ind.
View our latest analysis for Michang Oil Ind
What Does The Institutional Ownership Tell Us About Michang Oil Ind?
Institutions typically measure themselves against a benchmark when reporting to their own investors, so they often become more enthusiastic about a stock once it's included in a major index. We would expect most companies to have some institutions on the register, especially if they are growing.
We can see that Michang Oil Ind does have institutional investors; and they hold a good portion of the company's stock. This can indicate that the company has a certain degree of credibility in the investment community. However, it is best to be wary of relying on the supposed validation that comes with institutional investors. They too, get it wrong sometimes. When multiple institutions own a stock, there's always a risk that they are in a 'crowded trade'. When such a trade goes wrong, multiple parties may compete to sell stock fast. This risk is higher in a company without a history of growth. You can see Michang Oil Ind's historic earnings and revenue below, but keep in mind there's always more to the story.

Hedge funds don't have many shares in Michang Oil Ind. Looking at our data, we can see that the largest shareholder is the CEO Jae-Soon Yoo with 46% of shares outstanding. The second and third largest shareholders are ENEOS Holdings, Inc. and FMR LLC, with an equal amount of shares to their name at 11%.
After doing some more digging, we found that the top 2 shareholders collectively control more than half of the company's shares, implying that they have considerable power to influence the company's decisions.
Researching institutional ownership is a good way to gauge and filter a stock's expected performance. The same can be achieved by studying analyst sentiments. Our information suggests that there isn't any analyst coverage of the stock, so it is probably little known.
Insider Ownership Of Michang Oil Ind
The definition of company insiders can be subjective and does vary between jurisdictions. Our data reflects individual insiders, capturing board members at the very least. Management ultimately answers to the board. However, it is not uncommon for managers to be executive board members, especially if they are a founder or the CEO.
Most consider insider ownership a positive because it can indicate the board is well aligned with other shareholders. However, on some occasions too much power is concentrated within this group.
Our information suggests that insiders maintain a significant holding in Michang Oil Ind. Co., Ltd.. Insiders own ₩88b worth of shares in the ₩190b company. We would say this shows alignment with shareholders, but it is worth noting that the company is still quite small; some insiders may have founded the business. You can click here to see if those insiders have been buying or selling.
General Public Ownership
The general public, who are usually individual investors, hold a 28% stake in Michang Oil Ind. While this group can't necessarily call the shots, it can certainly have a real influence on how the company is run.
Public Company Ownership
We can see that public companies hold 11% of the Michang Oil Ind shares on issue. We can't be certain but it is quite possible this is a strategic stake. The businesses may be similar, or work together.
Next Steps:
It's always worth thinking about the different groups who own shares in a company. But to understand Michang Oil Ind better, we need to consider many other factors. Take risks for example - Michang Oil Ind has 3 warning signs (and 2 which are a bit unpleasant) we think you should know about.
If you would prefer check out another company -- one with potentially superior financials -- then do not miss this free list of interesting companies, backed by strong financial data.
NB: Figures in this article are calculated using data from the last twelve months, which refer to the 12-month period ending on the last date of the month the financial statement is dated. This may not be consistent with full year annual report figures.
Have feedback on this article? Concerned about the content? Get in touch with us directly. Alternatively, email editorial-team (at) simplywallst.com.
This article by Simply Wall St is general in nature. We provide commentary based on historical data and analyst forecasts only using an unbiased methodology and our articles are not intended to be financial advice. It does not constitute a recommendation to buy or sell any stock, and does not take account of your objectives, or your financial situation. We aim to bring you long-term focused analysis driven by fundamental data. Note that our analysis may not factor in the latest price-sensitive company announcements or qualitative material. Simply Wall St has no position in any stocks mentioned.