
- LIVE QUOTES
- LEARN
- HELP


EN
Assessing Firefly Aerospace (FLY) Valuation After a Sharp 3-Month Share Price Decline
Firefly Aerospace (FLY) has had a choppy stretch lately, with the stock jumping about 8% in the last session but still sitting sharply lower over the past 3 months.
See our latest analysis for Firefly Aerospace.
That sharp 1 day share price return of 8.31% looks more like a brief relief rally than a trend change, given the roughly 55% 3 month and 66% year to date share price declines. These moves signal that sentiment and momentum are still fading despite the company’s growth story.
If Firefly’s recent volatility has you rethinking your exposure to the sector, this could be a good moment to explore other aerospace and defense stocks that might offer a different balance of risk and upside.
With analysts seeing upside to their target price and fundamentals showing rapid top line growth but steep losses, the key question now is whether Firefly is trading below its true potential or if the market already reflects its future trajectory.
Price-to-Sales of 28.7x: Is It Justified?
On a price-to-sales basis, Firefly Aerospace looks richly valued, with its 28.7x multiple sitting well above both peers and the broader Aerospace and Defense industry, despite the recent share price slide to 20.07 dollars.
The price-to-sales ratio compares the company’s market value with its revenue, a useful lens for high growth, loss making businesses where earnings are still negative. For Firefly, investors are effectively paying nearly 29 dollars for every 1 dollar of current sales, which assumes substantial future scaling and margin improvement to justify that premium.
Compared with the US Aerospace and Defense industry average of about 3x sales, as well as a peer average of roughly 2.9x, Firefly’s multiple is almost an order of magnitude higher. That gap suggests the market is already baking in aggressive growth and a successful transition to profitability, leaving less room for disappointment if execution or sector conditions fall short.
See what the numbers say about this price — find out in our valuation breakdown.
Result: Price-to-Sales of 28.7x (OVERVALUED)
However, significant ongoing losses and execution risk on ambitious launch and lunar programs could quickly challenge the premium valuation if milestones slip.
Find out about the key risks to this Firefly Aerospace narrative.
Another Angle: Our DCF Model Suggests It May Be Cheap
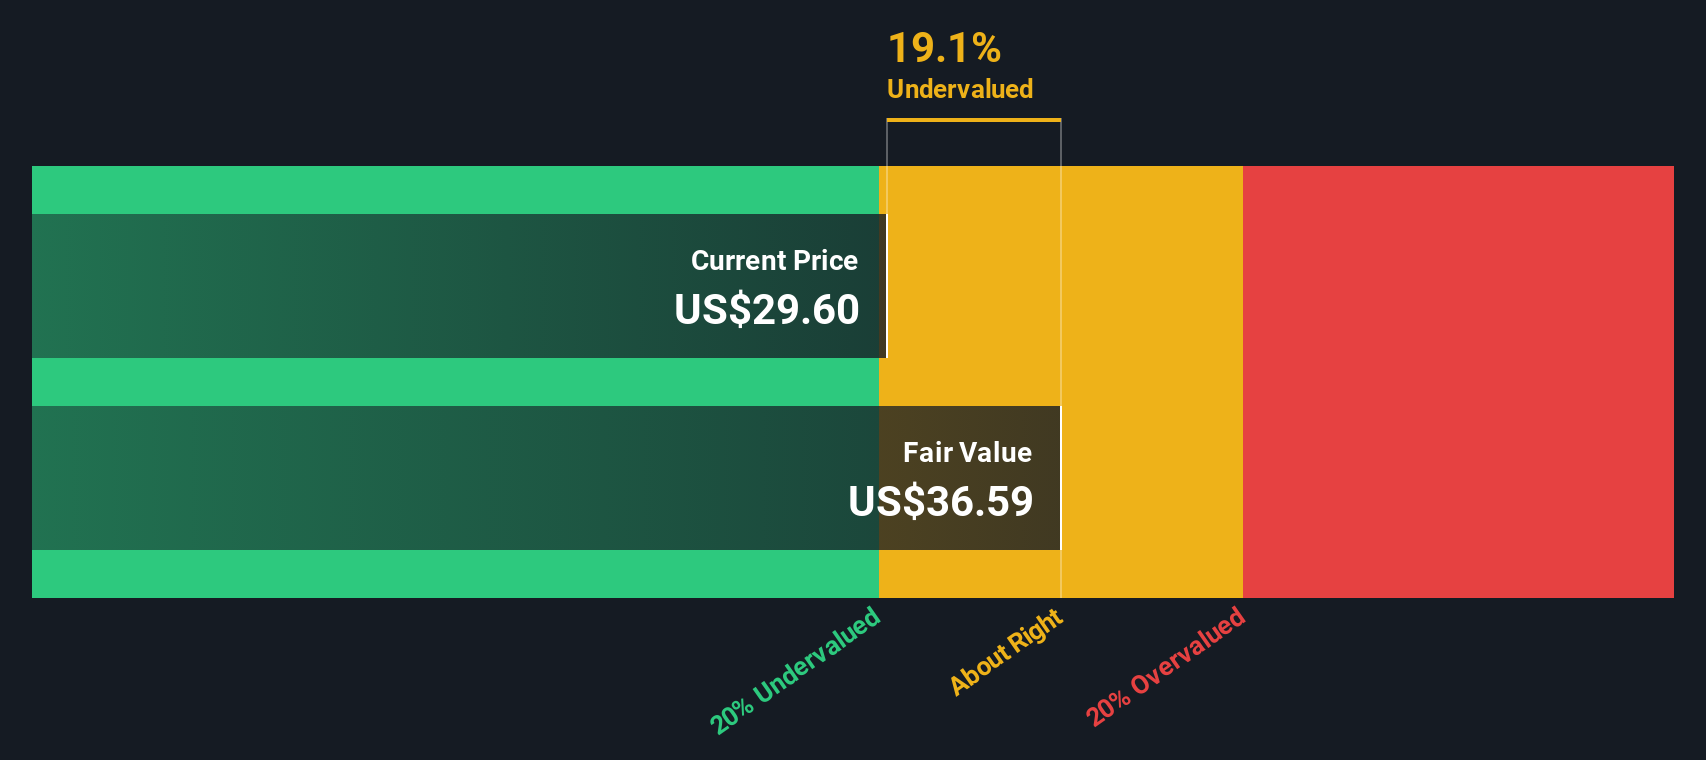
While the rich 28.7x sales multiple appears to indicate overvaluation, our DCF model suggests fair value around 52.29 dollars a share, about 61.6% above today’s price. Is the market putting a high price on sales yet underestimating long term cash generation potential?
Look into how the SWS DCF model arrives at its fair value.
Simply Wall St performs a discounted cash flow (DCF) on every stock in the world every day (check out Firefly Aerospace for example). We show the entire calculation in full. You can track the result in your watchlist or portfolio and be alerted when this changes, or use our stock screener to discover 914 undervalued stocks based on their cash flows. If you save a screener we even alert you when new companies match - so you never miss a potential opportunity.
Build Your Own Firefly Aerospace Narrative
If you see the numbers differently or want to stress test your own thesis, you can build a personalized view in just a few minutes: Do it your way.
A great starting point for your Firefly Aerospace research is our analysis highlighting 3 key rewards and 1 important warning sign that could impact your investment decision.
Looking for more investment ideas?
Before you move on, lock in your next steps by using the Simply Wall Street Screener to uncover focused opportunities you might otherwise overlook in today’s market.
- Target future leaders by scanning these 25 AI penny stocks that are harnessing artificial intelligence to transform entire industries and capture accelerating revenue streams.
- Strengthen your long term returns by focusing on income opportunities from these 13 dividend stocks with yields > 3% that may complement or offset higher risk growth positions.
- Capitalize on market mispricings with these 914 undervalued stocks based on cash flows that could offer powerful upside if sentiment eventually catches up to underlying cash flows.
This article by Simply Wall St is general in nature. We provide commentary based on historical data and analyst forecasts only using an unbiased methodology and our articles are not intended to be financial advice. It does not constitute a recommendation to buy or sell any stock, and does not take account of your objectives, or your financial situation. We aim to bring you long-term focused analysis driven by fundamental data. Note that our analysis may not factor in the latest price-sensitive company announcements or qualitative material. Simply Wall St has no position in any stocks mentioned.
Have feedback on this article? Concerned about the content? Get in touch with us directly. Alternatively, email editorial-team@simplywallst.com