
- LIVE QUOTES
- LEARN
- HELP
 Nasdaq
 Wall Street Journal
EN
Is MSCI Fairly Priced After Recent ESG and Passive Investing Tailwinds in 2025?
- If you have ever looked at MSCI and wondered whether the current share price really makes sense, you are not alone. This article is going to unpack that valuation puzzle step by step.
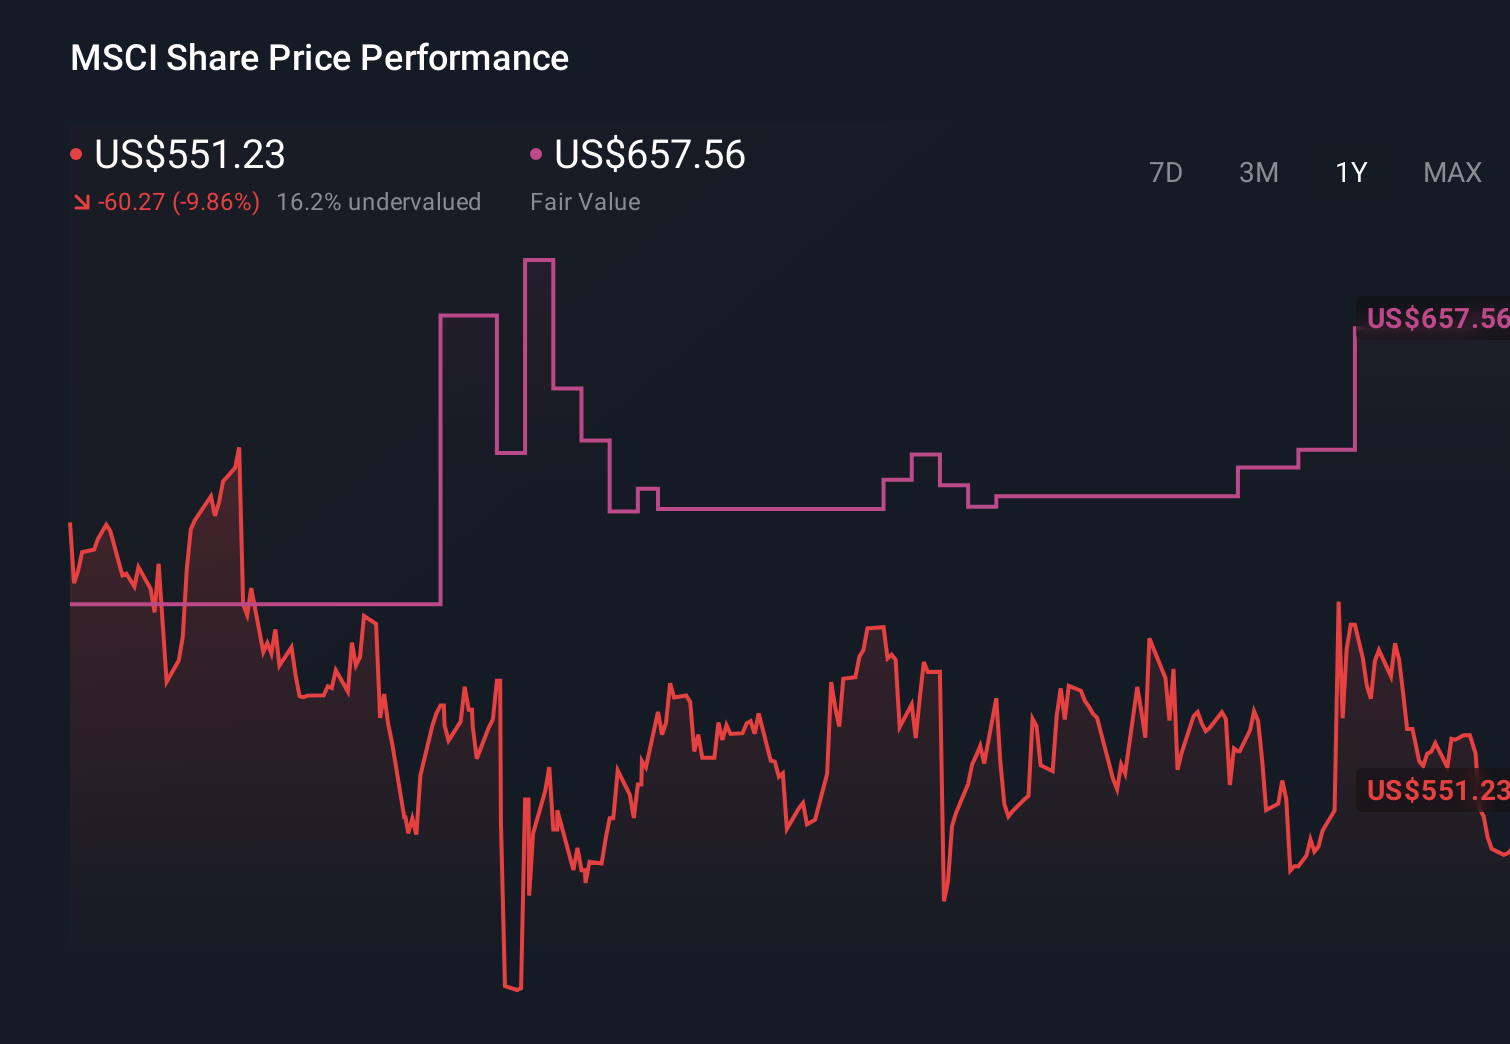
- MSCI is trading around $562.40, up 2.1% over the last week and 0.5% over the last month, even though the stock is still down 5.8% year to date and over the past year, while longer-term 3-year and 5-year returns of 25.6% and 36.9% hint at a business that has compounded value over time.
- Recently, investors have been digesting a mix of macro and industry news around global index flows, passive investing trends and demand for ESG and climate data, all of which tie directly into MSCI’s core franchises. There has also been ongoing discussion about regulatory scrutiny of index providers and evolving investor appetite for factor and thematic indices, which helps explain some of the shifting sentiment reflected in the latest price moves.
- Right now, MSCI scores just 0/6 on our valuation checks, suggesting it does not screen as undervalued on traditional metrics. We will walk through how DCF, multiples and other methods look from here, before ending with a more holistic way to think about the stock’s real worth.
MSCI scores just 0/6 on our valuation checks. See what other red flags we found in the full valuation breakdown.
Approach 1: MSCI Discounted Cash Flow (DCF) Analysis
A Discounted Cash Flow model estimates what a company is worth by projecting the cash it can generate in the future and discounting those cash flows back to today using a required rate of return.
For MSCI, the latest twelve month Free Cash Flow is about $1.40 billion. Analysts expect this to keep growing, with Simply Wall St’s 2 Stage Free Cash Flow to Equity model projecting Free Cash Flow rising to around $2.09 billion by 2029, and continuing to climb toward the mid $2 billion range over the following years based on extrapolated assumptions.
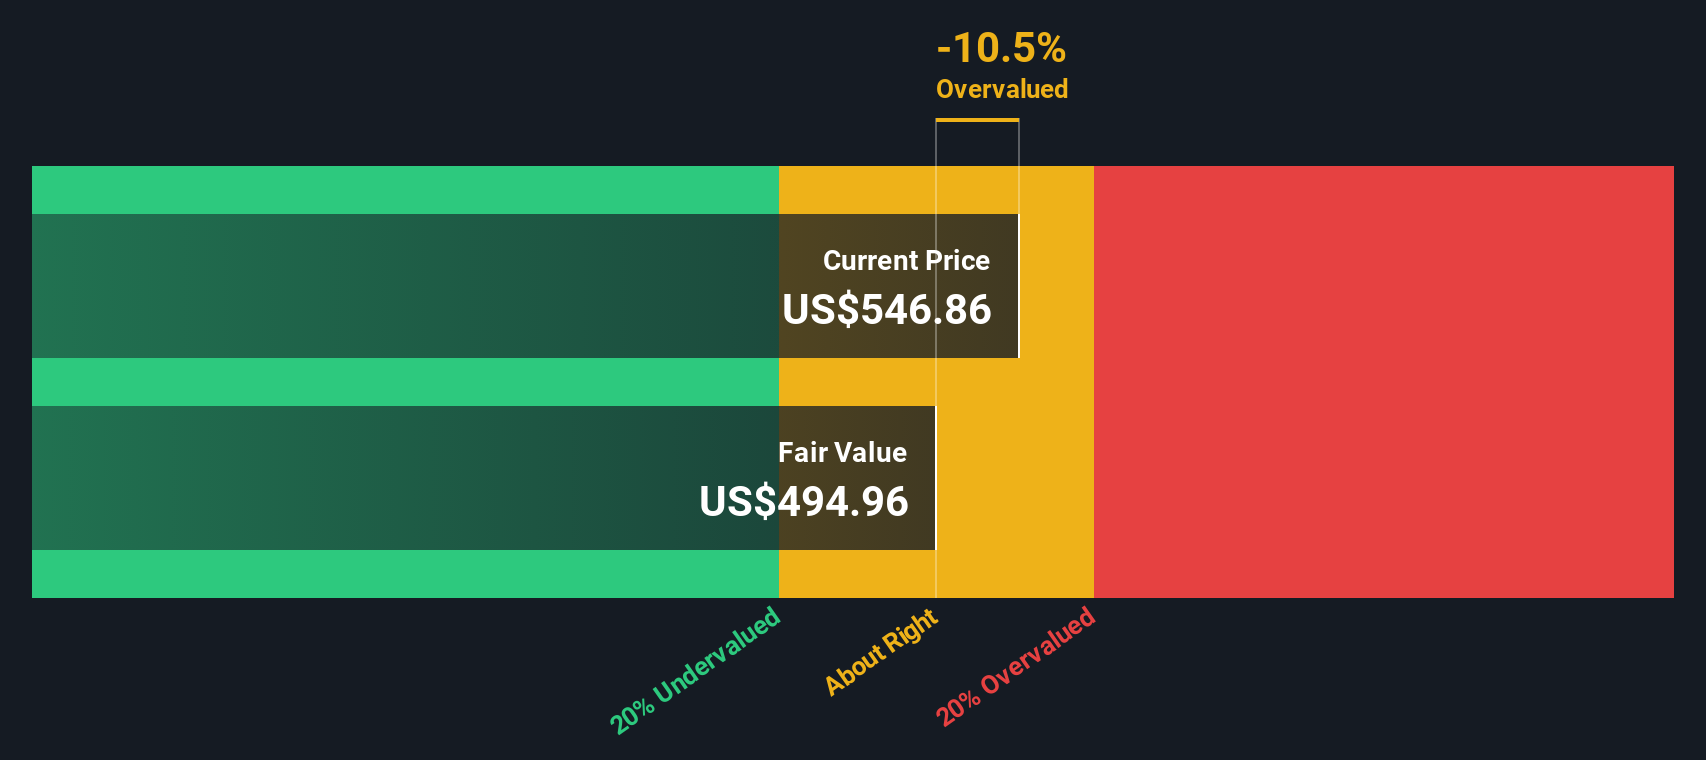
When all those projected cash flows are discounted back to today, the model suggests an intrinsic value of roughly $528.80 per share. Compared with the current share price of about $562.40, the DCF points to MSCI trading around 6.4% above its estimated fair value, which sits in the “close enough” range rather than implying a major mispricing.
Result: ABOUT RIGHT
MSCI is fairly valued according to our Discounted Cash Flow (DCF), but this can change at a moment's notice. Track the value in your watchlist or portfolio and be alerted on when to act.
Approach 2: MSCI Price vs Earnings
For a profitable, mature business like MSCI, the Price to Earnings ratio is a natural way to think about valuation because it links what investors pay today to the earnings the company is already generating. In general, higher expected growth and lower risk can justify a higher PE, while slower growth or elevated risk should translate into a lower, more conservative multiple.
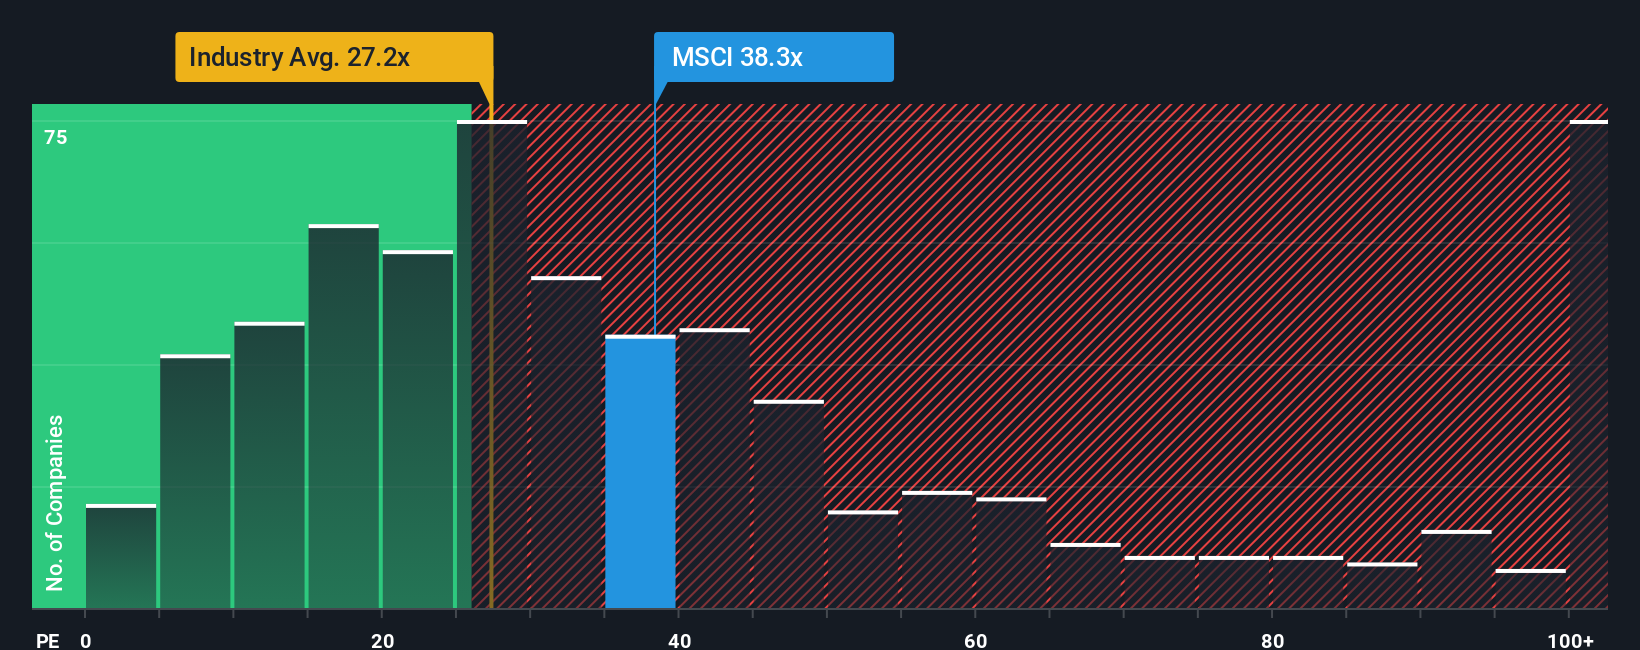
MSCI currently trades on about 34.5x earnings, which is a premium to both the broader Capital Markets industry average of roughly 25.3x and the peer group average of around 33.6x. Simply Wall St’s proprietary Fair Ratio model goes a step further by estimating what a “reasonable” PE should be, given MSCI’s specific earnings growth outlook, margins, industry, market cap and risk profile. That Fair Ratio comes out at about 16.6x, well below where the stock is currently trading. This suggests the market is paying a hefty premium relative to what those fundamentals would typically support.
Result: OVERVALUED
PE ratios tell one story, but what if the real opportunity lies elsewhere? Discover 1466 companies where insiders are betting big on explosive growth.
Upgrade Your Decision Making: Choose your MSCI Narrative
Earlier we mentioned that there is an even better way to understand valuation, so let us introduce you to Narratives, a simple framework on Simply Wall St’s Community page that lets you connect your view of a company’s story to a financial forecast and then to a fair value. Instead of just accepting a single target price or a static multiple, you describe your perspective on MSCI, such as how fast its recurring revenue can grow, where margins might settle and what multiple the market could reasonably pay, and the Narrative turns those assumptions into explicit forecasts for revenue, earnings and profitability. From there, the tool calculates a fair value that you can compare directly with today’s share price to decide whether MSCI looks like a buy, hold or sell, and because Narratives update dynamically as new news, earnings and guidance come in, your fair value can evolve with the story. For example, one MSCI Narrative on the platform might see fair value closer to the bullish 700 dollar target, while another more cautious view might anchor around the bearish 520 dollar target, giving you a transparent range of outcomes to test your own conviction against.
Do you think there's more to the story for MSCI? Head over to our Community to see what others are saying!
This article by Simply Wall St is general in nature. We provide commentary based on historical data and analyst forecasts only using an unbiased methodology and our articles are not intended to be financial advice. It does not constitute a recommendation to buy or sell any stock, and does not take account of your objectives, or your financial situation. We aim to bring you long-term focused analysis driven by fundamental data. Note that our analysis may not factor in the latest price-sensitive company announcements or qualitative material. Simply Wall St has no position in any stocks mentioned.
Have feedback on this article? Concerned about the content? Get in touch with us directly. Alternatively, email editorial-team@simplywallst.com