
- LIVE QUOTES
- LEARN
- HELP
 Nasdaq
 Wall Street Journal
EN
Is It Too Late to Consider Globus Medical After Its Recent Spine Technology Push?
- If you are wondering whether Globus Medical at around $86.88 is still a smart buy, or if the easy money has already been made, you are not alone. That is exactly what we are going to unpack here.
- The stock is up 6.2% year to date and 6.0% over the last year, with a 33.0% gain over 5 years, even though it has slipped 2.3% over the past week and sits about 4.1% higher than a month ago.
- Recent headlines have focused on Globus Medical's continued push into enabling technologies and advanced spine solutions, where the company is trying to lock in a larger share of complex surgical procedures. At the same time, investors have been watching how its integration moves and competitive positioning in the medtech space might influence long term growth expectations and risk.
- On our valuation checks, Globus Medical scores a 3 out of 6, suggesting the market may only be partially pricing in its fundamentals. Next, we will walk through DCF, multiples and other traditional tools before ending with a more holistic way to think about what this valuation really means for long term investors.
Approach 1: Globus Medical Discounted Cash Flow (DCF) Analysis
A Discounted Cash Flow model estimates what a company is worth by projecting the cash it can generate in the future and discounting those cash flows back to today using a required return.
For Globus Medical, the latest twelve month Free Cash Flow is about $573.8 Million. Using a 2 Stage Free Cash Flow to Equity model, analysts provide detailed estimates out to 2027, with Free Cash Flow expected to reach roughly $643.4 Million by then. Beyond that, Simply Wall St extrapolates additional years, with projected Free Cash Flow rising to about $849.5 Million in 2035 as growth gradually tapers.
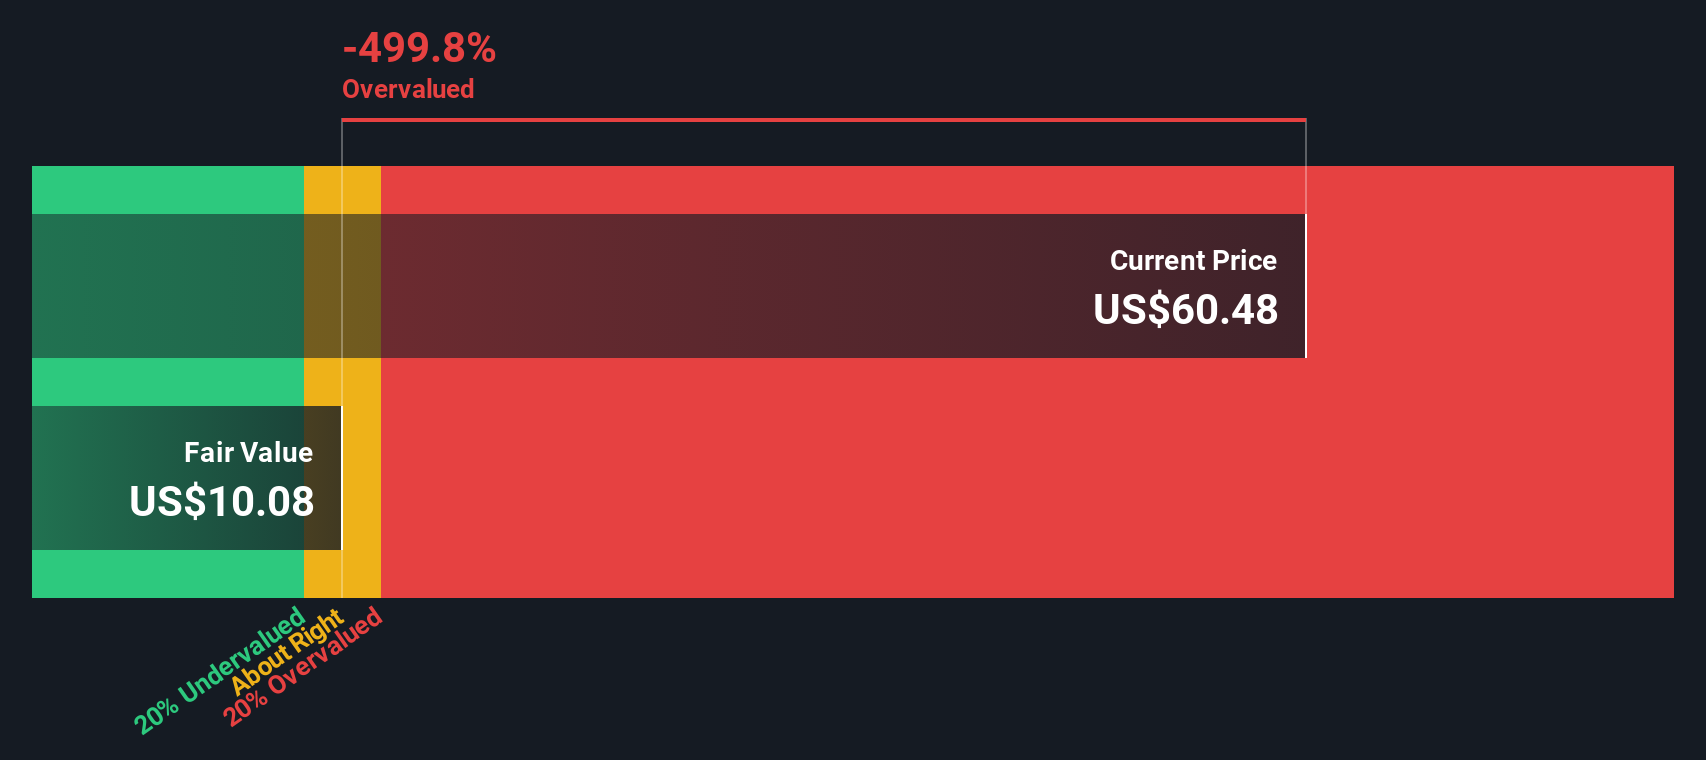
When all those future cash flows are discounted back and summed, the model arrives at an intrinsic value of roughly $105.09 per share. Compared with the current market price around $86.88, the DCF suggests the stock is about 17.3% undervalued, indicating that the market may not be fully pricing in its cash generation potential.
Result: UNDERVALUED
Our Discounted Cash Flow (DCF) analysis suggests Globus Medical is undervalued by 17.3%. Track this in your watchlist or portfolio, or discover 918 more undervalued stocks based on cash flows.
Approach 2: Globus Medical Price vs Earnings
For profitable companies like Globus Medical, the Price to Earnings, or PE, ratio is a useful way to see what investors are willing to pay today for each dollar of current earnings. It also naturally ties into expectations, since a higher PE usually reflects stronger anticipated growth or lower perceived risk, while a lower PE can signal slower growth or higher uncertainty.
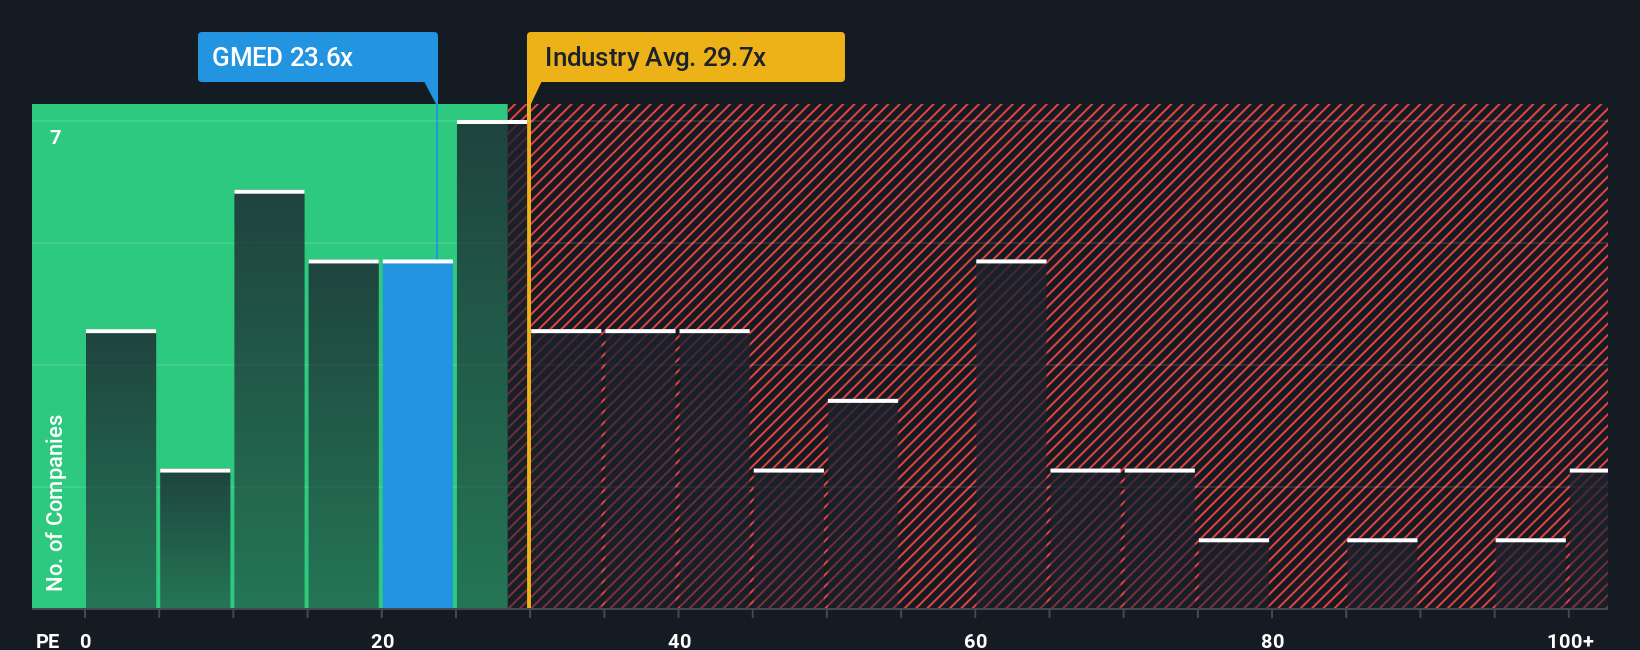
Globus Medical currently trades on a PE of about 27.4x. That sits below the Medical Equipment industry average of roughly 30.6x and is well under the peer group average near 60.6x, which might initially suggest the stock is conservatively valued relative to other names in its space. However, these simple comparisons can miss important differences in growth prospects, profitability, size and risk profiles across companies.
Simply Wall St addresses this with its Fair Ratio, a proprietary estimate of what a reasonable PE should be for Globus Medical after adjusting for its earnings growth outlook, industry, profit margins, market capitalization and company specific risks. For Globus, the Fair Ratio comes out around 23.8x, which is below the current 27.4x. That points to the shares trading modestly above what the fundamentals would justify on this metric.
Result: OVERVALUED
PE ratios tell one story, but what if the real opportunity lies elsewhere? Discover 1460 companies where insiders are betting big on explosive growth.
Upgrade Your Decision Making: Choose your Globus Medical Narrative
Earlier we mentioned that there is an even better way to understand valuation, so let us introduce you to Narratives, a simple way to connect your view of Globus Medical’s story with concrete numbers like future revenue, earnings, margins, and a fair value estimate.
A Narrative on Simply Wall St is your investment story turned into a financial forecast, where you spell out what you think will drive the business, how that flows into future cash flows and earnings, and what price per share would then look reasonable.
Because Narratives live on the Community page used by millions of investors, they make it easy to see how different assumptions lead to different fair values, and to compare those fair values to the current market price to decide whether you want to buy, hold, or sell.
They also update dynamically as new information like earnings, guidance changes, or major news arrives. Your view of Globus Medical can evolve from, for example, a more bullish narrative that justifies a fair value near $106 per share to a more cautious stance closer to $65 if you decide integration or margin risks matter more than you initially thought.
Do you think there's more to the story for Globus Medical? Head over to our Community to see what others are saying!

This article by Simply Wall St is general in nature. We provide commentary based on historical data and analyst forecasts only using an unbiased methodology and our articles are not intended to be financial advice. It does not constitute a recommendation to buy or sell any stock, and does not take account of your objectives, or your financial situation. We aim to bring you long-term focused analysis driven by fundamental data. Note that our analysis may not factor in the latest price-sensitive company announcements or qualitative material. Simply Wall St has no position in any stocks mentioned.
Have feedback on this article? Concerned about the content? Get in touch with us directly. Alternatively, email editorial-team@simplywallst.com