
- LIVE QUOTES
- LEARN
- HELP
 Nasdaq
 Wall Street Journal
EN
Has HSBC Run Too Far After a 47% 2025 Rally?
- If you have been wondering whether HSBC Holdings is still good value after its huge run, you are not alone. This piece will walk through whether the current price still stacks up.
- The stock has climbed 3.4% over the last week, 8.9% over the past month, and a striking 46.8% year to date, building on 58.6% over 1 year and more than tripling over 5 years.
- Recently, investors have been reacting to a mix of macro headlines, from shifting interest rate expectations that affect global banks, to ongoing regulatory and geopolitical developments in HSBC's key markets. Together, these have reshaped how the market prices HSBC's balance of risk and growth.
- Right now, HSBC scores 2/6 on our valuation checks. In the next sections we will test that against multiple valuation approaches and then finish with a more holistic way of thinking about what the stock is really worth.
HSBC Holdings scores just 2/6 on our valuation checks. See what other red flags we found in the full valuation breakdown.
Approach 1: HSBC Holdings Excess Returns Analysis
The Excess Returns model looks at how much profit a bank can generate above the return that shareholders demand, then capitalizes those excess profits into an intrinsic value per share.
For HSBC Holdings, the starting point is its book value of £9.94 per share and a stable earnings per share estimate of £1.53, based on weighted future return on equity forecasts from 16 analysts. With an average return on equity of 14.25% versus a cost of equity of £0.91 per share, the model estimates an excess return of £0.62 per share, meaning HSBC is expected to earn comfortably more than its implied equity cost.
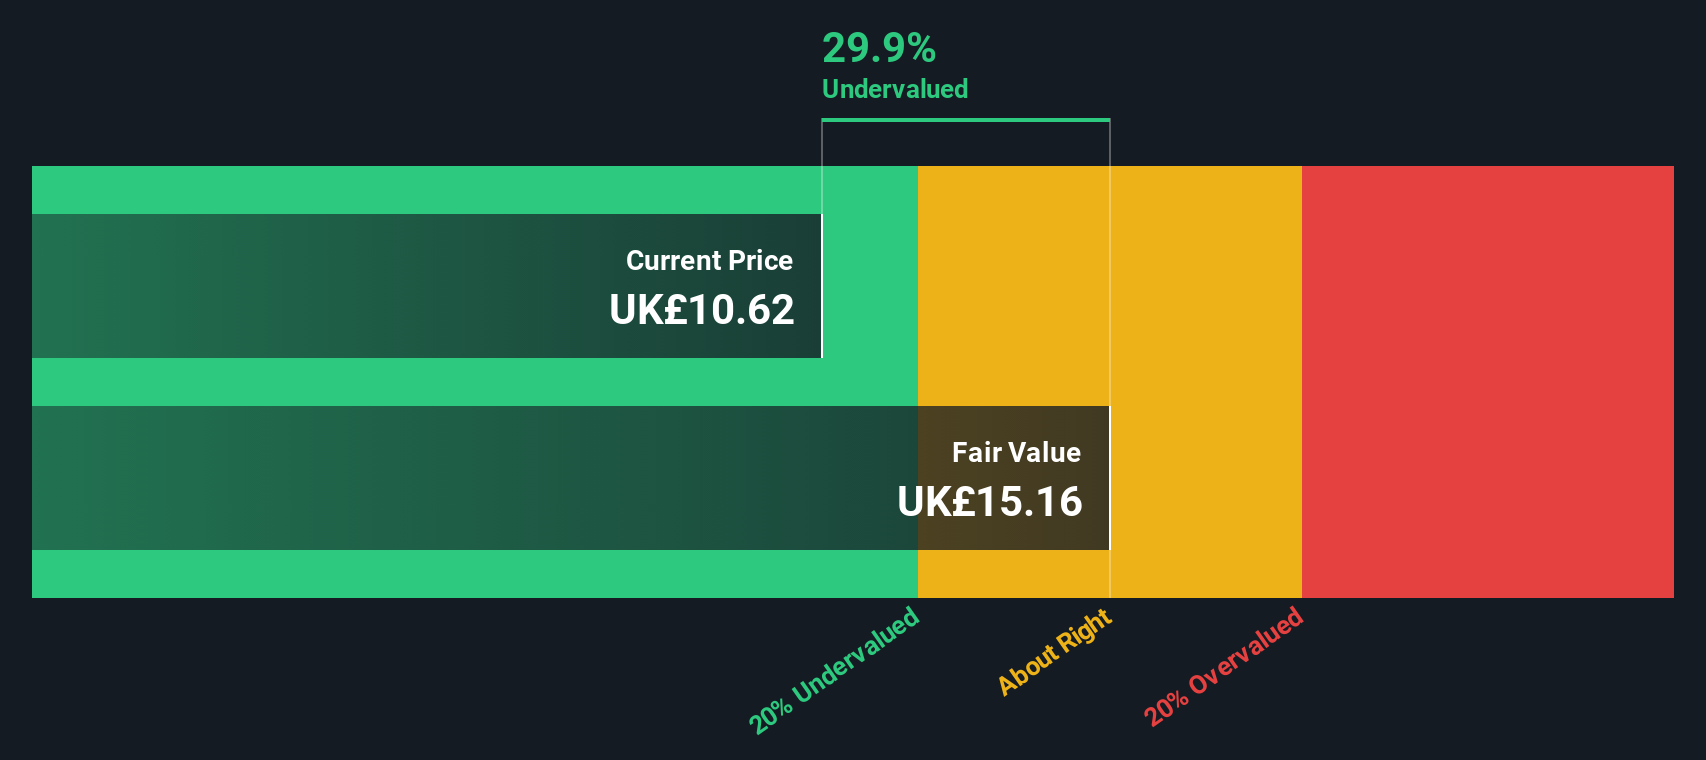
Analysts also expect the stable book value to rise to about £10.77 per share, supported by projections from 7 analysts. Using these inputs in the Excess Returns framework produces an intrinsic value of roughly £16.60 per share, which is about 30.7% above the current market price, implying the stock is meaningfully undervalued on this basis.
Result: UNDERVALUED
Our Excess Returns analysis suggests HSBC Holdings is undervalued by 30.7%. Track this in your watchlist or portfolio, or discover 918 more undervalued stocks based on cash flows.
Approach 2: HSBC Holdings Price vs Earnings
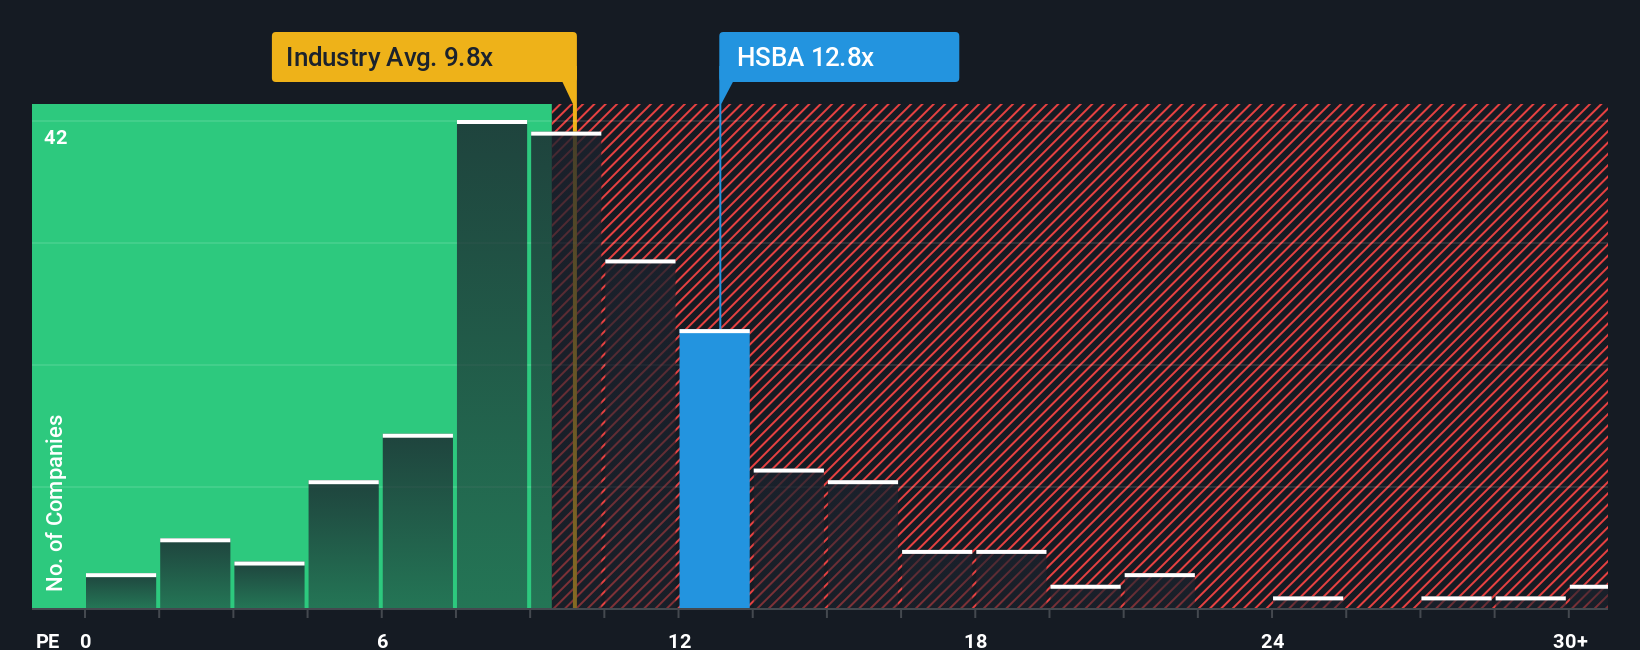
For a consistently profitable bank like HSBC, the price to earnings ratio is a useful way to judge value because it directly links what investors pay today to the profits the business is generating each year. In general, faster growth and lower perceived risk justify a higher PE, while slower growth, more cyclical earnings, or higher risk usually mean a lower, more cautious multiple is appropriate.
HSBC currently trades on a PE of 15.93x, noticeably above the wider Banks industry average of 10.87x and above the 12.14x average of its peer group. To refine that comparison, Simply Wall St estimates a Fair Ratio of 10.23x for HSBC, which is the PE you might expect given its specific earnings growth outlook, profitability, risk profile, industry, and market cap. This Fair Ratio is more informative than a simple peer or industry comparison because it adjusts for HSBC’s own fundamentals rather than assuming all banks deserve the same multiple.
Since HSBC’s actual PE of 15.93x sits well above the 10.23x Fair Ratio, the stock screens as expensive on this earnings based lens.
Result: OVERVALUED
PE ratios tell one story, but what if the real opportunity lies elsewhere? Discover 1460 companies where insiders are betting big on explosive growth.
Upgrade Your Decision Making: Choose your HSBC Holdings Narrative
Earlier we mentioned that there is an even better way to understand valuation, so let us introduce you to Narratives. These are simply your own story about a company, connected to a clear financial forecast and a specific fair value so you can compare that to today’s price and decide whether to buy, hold, or sell.
On Simply Wall St’s Community page, used by millions of investors, Narratives let you spell out how you think HSBC’s strategy, risks, and opportunities will play out in its future revenue, earnings, and margins. The platform automatically links that story to a fair value estimate that updates dynamically as new news, guidance, or earnings come in.
For example, one HSBC Narrative might assume Asia focused wealth and trade growth, disciplined cost control, and rising margins that justify a fair value near the top analyst target of about £11.29. In contrast, a more cautious Narrative might focus on commercial real estate and geopolitical risks, lower growth, and tighter margins that only support a fair value closer to £7.93. This shows how different perspectives on the same bank lead to very different yet clearly quantified valuation views.
Do you think there's more to the story for HSBC Holdings? Head over to our Community to see what others are saying!

This article by Simply Wall St is general in nature. We provide commentary based on historical data and analyst forecasts only using an unbiased methodology and our articles are not intended to be financial advice. It does not constitute a recommendation to buy or sell any stock, and does not take account of your objectives, or your financial situation. We aim to bring you long-term focused analysis driven by fundamental data. Note that our analysis may not factor in the latest price-sensitive company announcements or qualitative material. Simply Wall St has no position in any stocks mentioned.
Have feedback on this article? Concerned about the content? Get in touch with us directly. Alternatively, email editorial-team@simplywallst.com