
- LIVE QUOTES
- LEARN
- HELP
 Nasdaq
 Wall Street Journal
EN
Reassessing Dynex Capital (DX) Valuation After Its Recent 3-Month Share Price Climb
Market context and recent performance
Dynex Capital (DX) has quietly trended higher, with the stock up about 3% over the past month and roughly 12% in the past 3 months, catching income focused investors attention.
See our latest analysis for Dynex Capital.
Stepping back, Dynex Capital’s recent 12 percent 3 month share price return and strong 1 year total shareholder return near 28 percent suggest momentum is building as investors grow more comfortable with its risk profile and yield story.
If Dynex Capital’s recent climb has you rethinking your income plays, this could be a smart moment to broaden your search and discover fast growing stocks with high insider ownership
With shares trading only slightly below analyst targets but at a steep premium to some intrinsic value estimates, investors face a key question: is Dynex Capital still undervalued, or is the market already pricing in future growth?
Price-to-Earnings of 11.5x: Is it justified?
Dynex Capital trades on a price to earnings ratio of 11.5 times, below both the wider US market and Mortgage REIT peers, which hints at relative value.
The price to earnings ratio compares what investors pay today for one dollar of current earnings. It is a key yardstick for income focused, mature financial businesses such as mortgage REITs.
For Dynex Capital, this discount suggests the market is not fully pricing in the strong recent earnings rebound and the sharply improving profit outlook implied by forecasts.
Against the US Mortgage REITs industry average multiple of 13.1 times and an estimated fair price to earnings ratio of 15.2 times, Dynex Capital’s lower 11.5 times multiple looks meaningfully conservative. This leaves room for the valuation to migrate closer to those higher reference points if growth continues to deliver.
Explore the SWS fair ratio for Dynex Capital
Result: Price-to-Earnings of 11.5x (UNDERVALUED)
However, investors should remember that Dynex Capital’s returns depend on sensitive interest rate spreads and mortgage credit conditions, which could quickly undermine recent valuation support.
Find out about the key risks to this Dynex Capital narrative.
Another angle on value
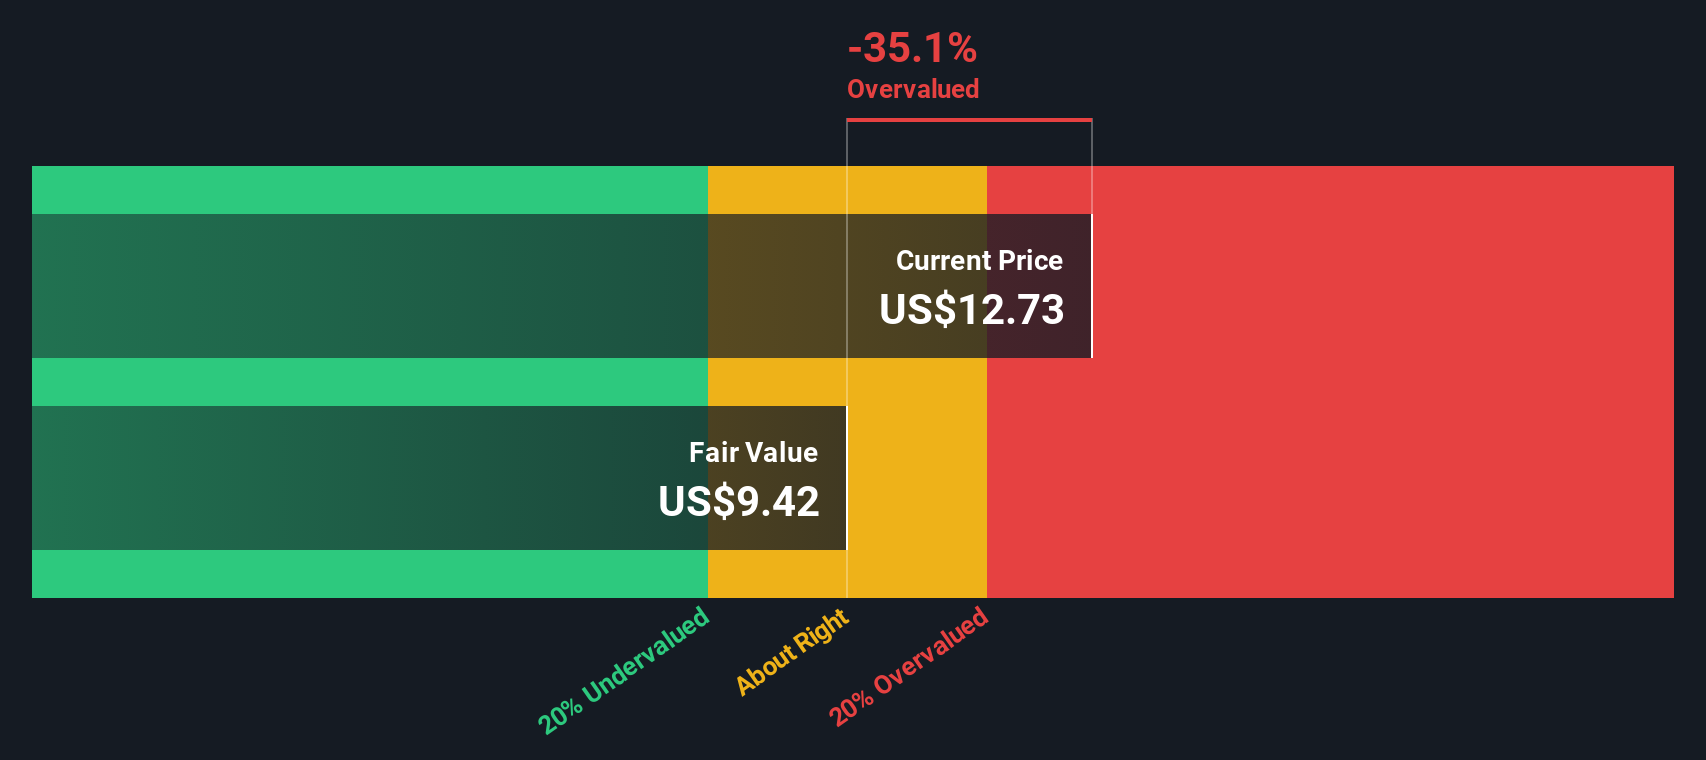
Our DCF model paints a very different picture, suggesting Dynex Capital is trading well above its estimated fair value, with the current price around 50 percent richer than our cash flow based estimate. If earnings stumble or rates move in an unfavorable direction, could this cushion vanish faster than expected?
Look into how the SWS DCF model arrives at its fair value.
Simply Wall St performs a discounted cash flow (DCF) on every stock in the world every day (check out Dynex Capital for example). We show the entire calculation in full. You can track the result in your watchlist or portfolio and be alerted when this changes, or use our stock screener to discover 916 undervalued stocks based on their cash flows. If you save a screener we even alert you when new companies match - so you never miss a potential opportunity.
Build Your Own Dynex Capital Narrative
If you would rather dig into the numbers yourself and challenge these assumptions, you can build a personalized view in just a few minutes: Do it your way.
A great starting point for your Dynex Capital research is our analysis highlighting 4 key rewards and 3 important warning signs that could impact your investment decision.
Looking for more investment ideas?
Before you move on, explore your next opportunity by scanning targeted shortlists that can help uncover compelling stocks your watchlist may be missing.
- Identify potential multi baggers early by reviewing these 3614 penny stocks with strong financials that combine small market caps with solid fundamentals.
- Consider the AI theme by checking out these 24 AI penny stocks that use machine learning and automation in their business models.
- Find candidates for portfolio income with these 13 dividend stocks with yields > 3% offering cash payouts above 3 percent.
This article by Simply Wall St is general in nature. We provide commentary based on historical data and analyst forecasts only using an unbiased methodology and our articles are not intended to be financial advice. It does not constitute a recommendation to buy or sell any stock, and does not take account of your objectives, or your financial situation. We aim to bring you long-term focused analysis driven by fundamental data. Note that our analysis may not factor in the latest price-sensitive company announcements or qualitative material. Simply Wall St has no position in any stocks mentioned.
Have feedback on this article? Concerned about the content? Get in touch with us directly. Alternatively, email editorial-team@simplywallst.com