
- LIVE QUOTES
- LEARN
- HELP
 Nasdaq
 Wall Street Journal
EN
Uncovering Opportunities: Zhejiang Yankon Group And 2 Other Promising Global Penny Stocks
As global markets react to the Federal Reserve's interest rate cuts and mixed economic signals, investors are exploring diverse opportunities amid fluctuating indices. Penny stocks, a term that may seem outdated but remains relevant, often represent smaller or less-established companies that can offer significant value. By focusing on those with robust financials and clear growth potential, investors can uncover promising opportunities in this niche market segment.
Top 10 Penny Stocks Globally
| Name | Share Price | Market Cap | Rewards & Risks |
| Lever Style (SEHK:1346) | HK$1.48 | HK$933.97M | ✅ 4 ⚠️ 1 View Analysis > |
| Foresight Group Holdings (LSE:FSG) | £4.14 | £474.95M | ✅ 5 ⚠️ 0 View Analysis > |
| IVE Group (ASX:IGL) | A$2.87 | A$434.94M | ✅ 4 ⚠️ 2 View Analysis > |
| TK Group (Holdings) (SEHK:2283) | HK$2.53 | HK$2.09B | ✅ 4 ⚠️ 1 View Analysis > |
| Angler Gaming (NGM:ANGL) | SEK3.60 | SEK269.95M | ✅ 4 ⚠️ 2 View Analysis > |
| Angler Gaming (DB:0QM) | €0.37 | €221.21M | ✅ 3 ⚠️ 3 View Analysis > |
| Yangzijiang Shipbuilding (Holdings) (SGX:BS6) | SGD3.47 | SGD13.66B | ✅ 5 ⚠️ 1 View Analysis > |
| Integrated Diagnostics Holdings (LSE:IDHC) | $0.685 | $398.21M | ✅ 4 ⚠️ 2 View Analysis > |
| Scott Technology (NZSE:SCT) | NZ$2.78 | NZ$235.47M | ✅ 4 ⚠️ 2 View Analysis > |
| Begbies Traynor Group (AIM:BEG) | £1.115 | £179.44M | ✅ 6 ⚠️ 1 View Analysis > |
Click here to see the full list of 3,623 stocks from our Global Penny Stocks screener.
Let's dive into some prime choices out of the screener.
Zhejiang Yankon Group (SHSE:600261)
Simply Wall St Financial Health Rating: ★★★★★★
Overview: Zhejiang Yankon Group Co., Ltd. focuses on the research, development, production, and sales of lighting appliances in China and has a market cap of CN¥4.54 billion.
Operations: The company's revenue primarily comes from the Lighting and Electrical Industry, generating CN¥2.71 billion.
Market Cap: CN¥4.54B
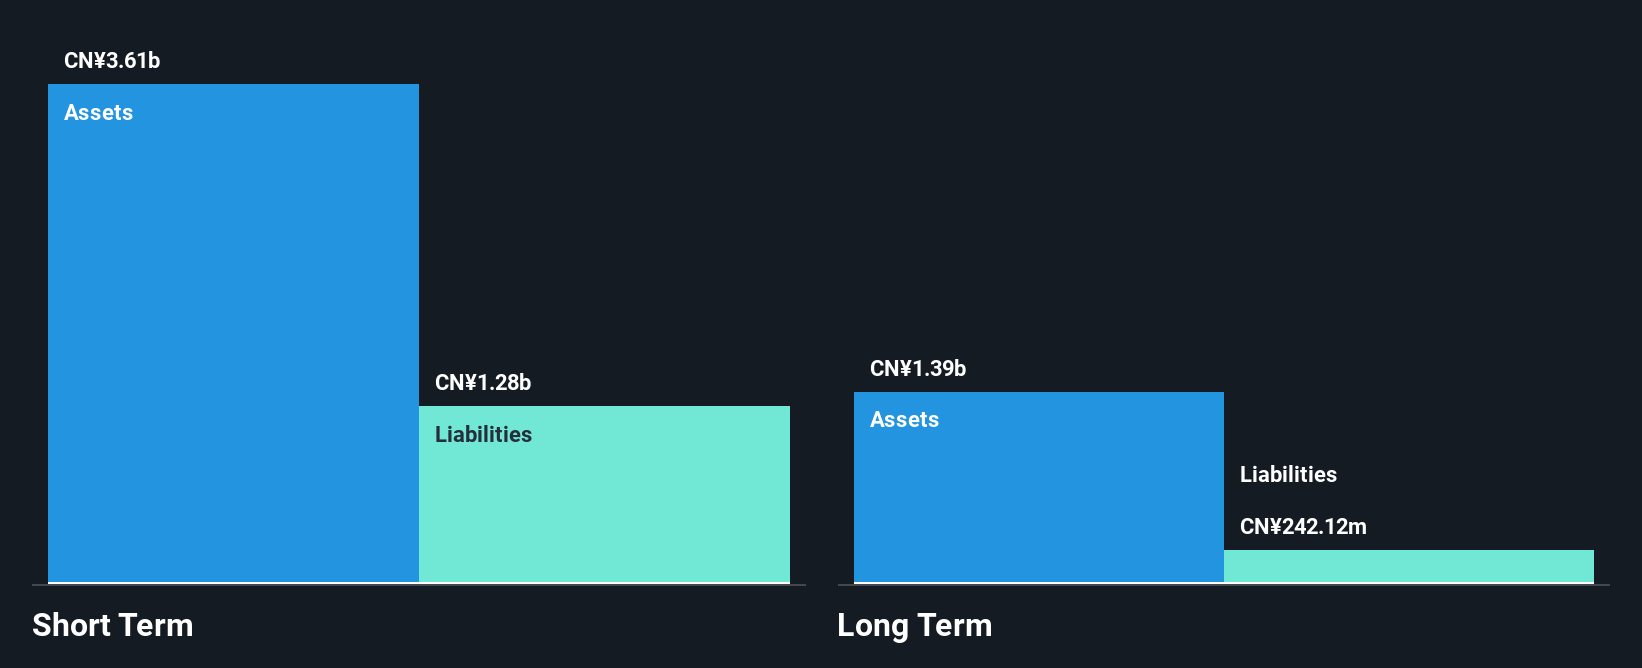
Zhejiang Yankon Group's recent earnings report reveals a decline in revenue to CN¥1.99 billion for the nine months ending September 2025, down from CN¥2.45 billion the previous year, with net income also decreasing to CN¥128.75 million. Despite this, the company maintains strong liquidity with short-term assets of CN¥3.7 billion surpassing both short and long-term liabilities significantly, and its debt is well-covered by operating cash flow. However, challenges include a low return on equity at 5.2% and declining profits over five years despite reduced debt levels and stable volatility in returns recently observed.
- Click here to discover the nuances of Zhejiang Yankon Group with our detailed analytical financial health report.
- Review our historical performance report to gain insights into Zhejiang Yankon Group's track record.
Shaanxi Beiyuan Chemical Industry Group (SHSE:601568)
Simply Wall St Financial Health Rating: ★★★★★★
Overview: Shaanxi Beiyuan Chemical Industry Group Co., Ltd. operates in the chemical industry and has a market cap of approximately CN¥14.86 billion.
Operations: Shaanxi Beiyuan Chemical Industry Group Co., Ltd. does not report specific revenue segments.
Market Cap: CN¥14.86B
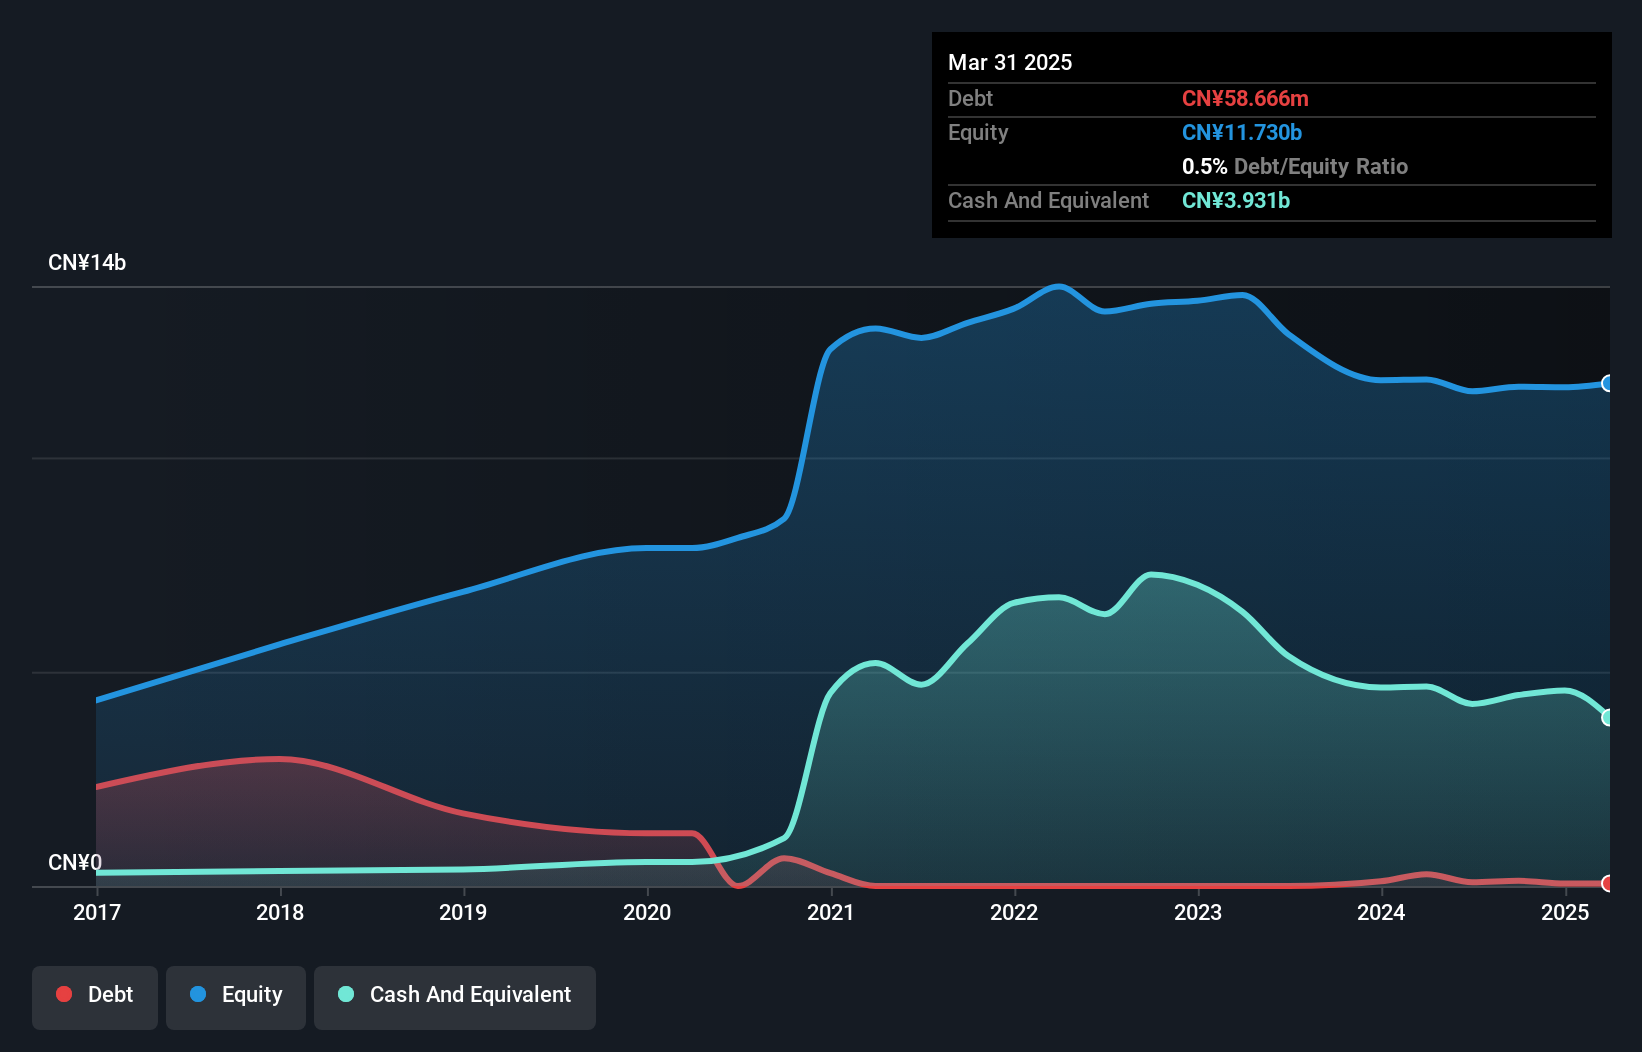
Shaanxi Beiyuan Chemical Industry Group's recent financials indicate a revenue drop to CN¥6.76 billion for the nine months ending September 2025, compared to CN¥7.51 billion the previous year, with net income slightly down at CN¥213.75 million. The company's stability is underpinned by its debt-free status and strong short-term assets of CN¥5.1 billion that comfortably cover liabilities, while earnings growth of 12.4% over the past year outpaces industry averages despite a history of declining profits and low return on equity at 1.8%. A significant one-off loss recently impacted its financial results, highlighting volatility concerns amidst management's seasoned leadership team with an average tenure of 5.6 years.
- Jump into the full analysis health report here for a deeper understanding of Shaanxi Beiyuan Chemical Industry Group.
- Gain insights into Shaanxi Beiyuan Chemical Industry Group's historical outcomes by reviewing our past performance report.
Suzhou Institute of Building Science GroupLtd (SHSE:603183)
Simply Wall St Financial Health Rating: ★★★★★☆
Overview: Suzhou Institute of Building Science Group Co., Ltd operates in the construction industry in China and has a market cap of CN¥2.14 billion.
Operations: The company generates revenue of CN¥838.84 million from its operations within China.
Market Cap: CN¥2.14B
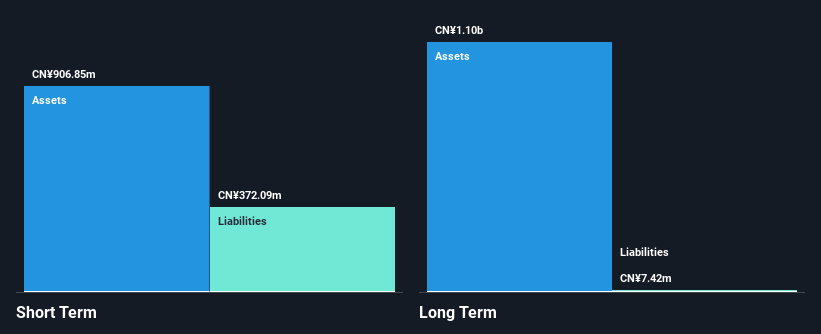
Suzhou Institute of Building Science Group Co., Ltd has seen a decline in revenue to CN¥507.34 million for the nine months ending September 2025, down from CN¥576.01 million the previous year, with net income also decreasing significantly to CN¥4.82 million. Despite these challenges, the company maintains a strong financial position with cash exceeding total debt and short-term assets covering both short and long-term liabilities comfortably. However, profitability concerns persist as profit margins have narrowed from 11.4% to 4.8%, and earnings growth has been negative over the past year despite forecasts suggesting potential future improvement at an annual rate of 27.82%.
- Click to explore a detailed breakdown of our findings in Suzhou Institute of Building Science GroupLtd's financial health report.
- Evaluate Suzhou Institute of Building Science GroupLtd's prospects by accessing our earnings growth report.
Make It Happen
- Click through to start exploring the rest of the 3,620 Global Penny Stocks now.
- Ready For A Different Approach? These 16 companies survived and thrived after COVID and have the right ingredients to survive Trump's tariffs. Discover why before your portfolio feels the trade war pinch.
This article by Simply Wall St is general in nature. We provide commentary based on historical data and analyst forecasts only using an unbiased methodology and our articles are not intended to be financial advice. It does not constitute a recommendation to buy or sell any stock, and does not take account of your objectives, or your financial situation. We aim to bring you long-term focused analysis driven by fundamental data. Note that our analysis may not factor in the latest price-sensitive company announcements or qualitative material. Simply Wall St has no position in any stocks mentioned.
Have feedback on this article? Concerned about the content? Get in touch with us directly. Alternatively, email editorial-team@simplywallst.com