
- LIVE QUOTES
- LEARN
- HELP
 Nasdaq
 Wall Street Journal
EN
Does International Paper’s 2025 Valuation Reflect its Recovery After a 27.4% Share Price Slide?
- Investors wondering if International Paper is quietly turning into a value opportunity while most attention is focused elsewhere may find that this is exactly the kind of stock where a bit of valuation work can really pay off.
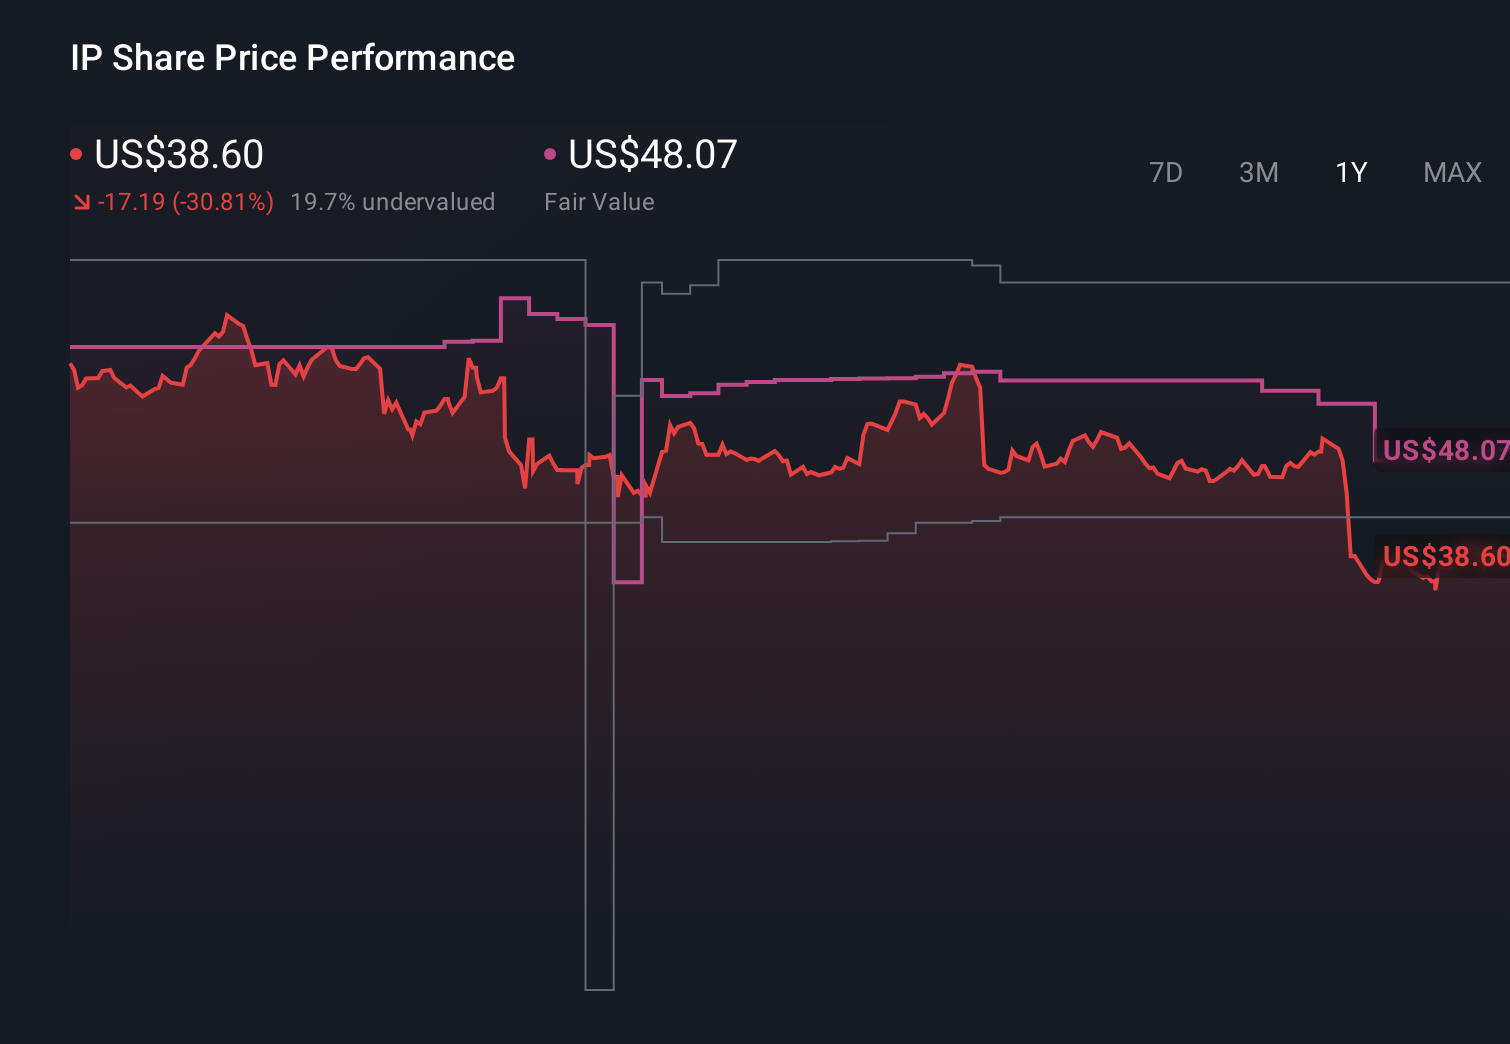
- The share price has been fairly steady over the last week, but that hides a 6.1% gain over the past month and a still hefty drag of around 27.4% year to date. This mix often signals shifting views on both risk and recovery potential.
- Recent headlines have focused on how International Paper is repositioning its portfolio and capacity to align with long term demand for packaging and fiber based products, which helps explain some of the renewed interest in the stock. At the same time, ongoing commentary around input costs, supply chain resilience and sustainability commitments is shaping expectations about how resilient its cash flows could be in the next cycle.
- On our checklist based valuation framework, International Paper scores a perfect 6 out of 6 for being undervalued across multiple metrics. Next we will unpack how different valuation approaches arrive at that verdict, and then finish with an even more intuitive way to think about what the market is really pricing in.
Find out why International Paper's -26.2% return over the last year is lagging behind its peers.
Approach 1: International Paper Discounted Cash Flow (DCF) Analysis
A Discounted Cash Flow model estimates what a company is worth today by projecting the cash it can generate in the future and then discounting those cash flows back into today’s dollars.
For International Paper, the latest twelve month Free Cash Flow is slightly negative at around $0.26 billion, reflecting a period of heavy investment and cyclical pressure. Analysts and our model expect this to swing firmly into positive territory, with projected Free Cash Flow rising to about $1.07 billion by 2026 and reaching roughly $2.61 billion by 2035. Estimates beyond the first few years are extrapolated to reflect a maturing but still growing packaging business.
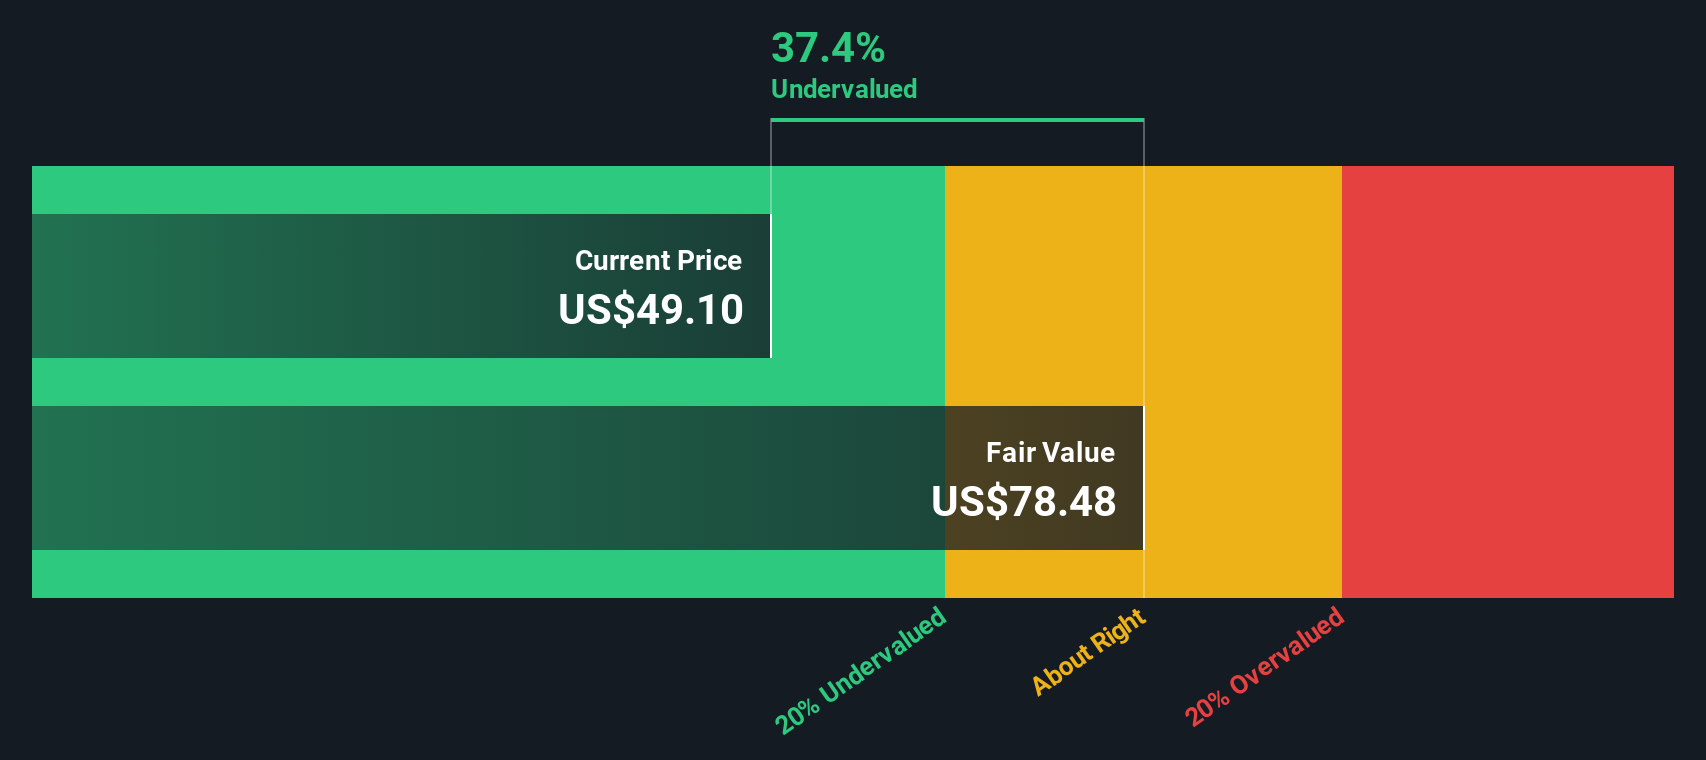
When all those future cash flows are discounted back using a 2 Stage Free Cash Flow to Equity approach, the resulting intrinsic value is about $84.33 per share. Compared with the current share price, this implies the stock trades at roughly a 54.2% discount. This suggests investors may be pricing in a much weaker long term recovery than the cash flow outlook used in this model.
Result: UNDERVALUED
Our Discounted Cash Flow (DCF) analysis suggests International Paper is undervalued by 54.2%. Track this in your watchlist or portfolio, or discover 916 more undervalued stocks based on cash flows.
Approach 2: International Paper Price vs Sales
For companies like International Paper that are navigating cyclical earnings and margin swings, the Price to Sales ratio is often a more reliable yardstick than earnings-based measures. Sales tend to be more stable, so this multiple can highlight how much investors are willing to pay for each dollar of revenue, given expectations for future growth and profitability.
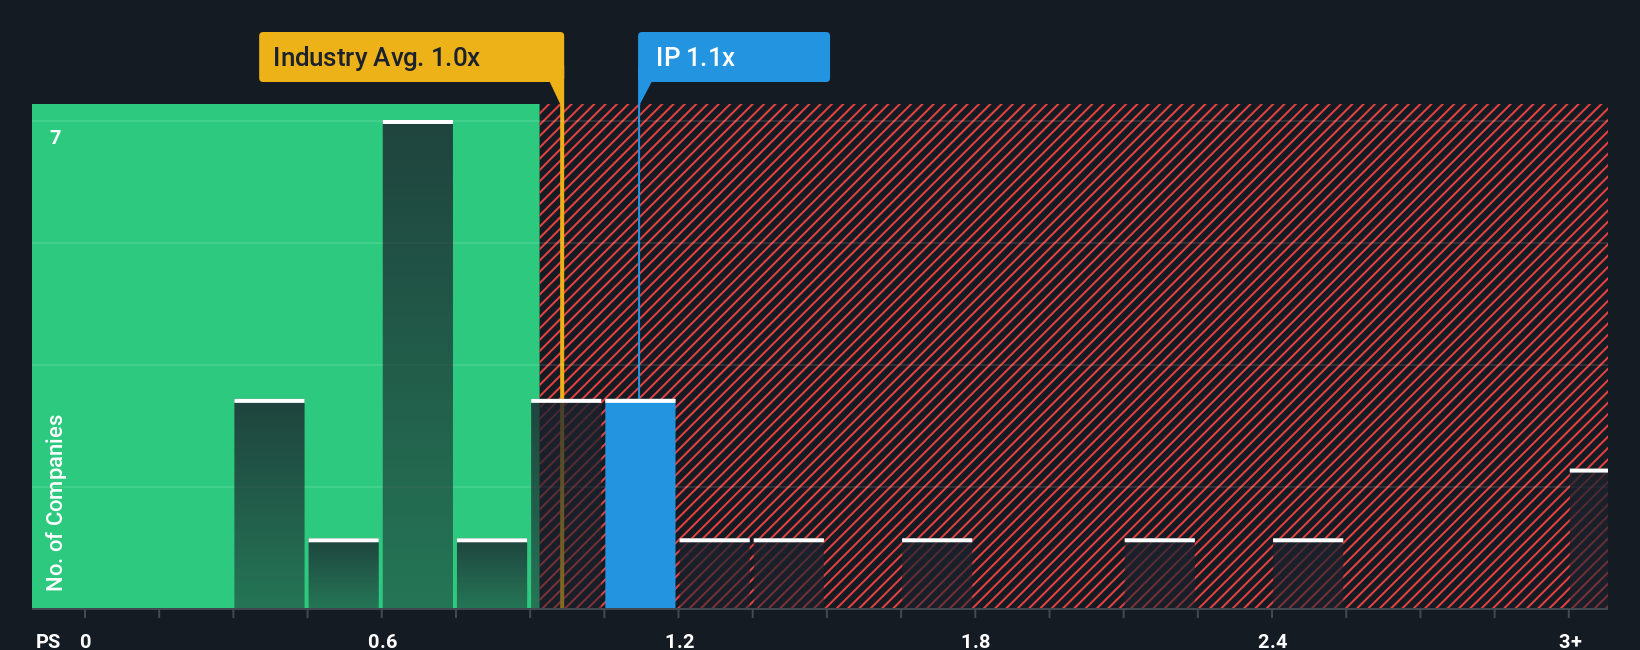
In general, stronger growth prospects and lower perceived risk justify a higher normal valuation multiple, while slower growth or higher uncertainty pull that fair range down. International Paper currently trades on a Price to Sales ratio of about 0.84x, which is below both the Packaging industry average of roughly 0.96x and the broader peer group average of around 1.36x.
Simply Wall St’s proprietary Fair Ratio framework takes this a step further. Instead of just comparing with peers, it estimates what a reasonable multiple could be based on factors such as earnings forecasts, profit margins, industry dynamics, company size and identified risks. For International Paper, the Fair Ratio comes out at about 1.69x, compared to the current 0.84x, which suggests that the market valuation is lower than this framework’s implied multiple.
Result: UNDERVALUED
PS ratios tell one story, but what if the real opportunity lies elsewhere? Discover 1455 companies where insiders are betting big on explosive growth.
Upgrade Your Decision Making: Choose your International Paper Narrative
Earlier we mentioned that there is an even better way to understand valuation, so let us introduce you to Narratives, which are simply the stories investors tell about a company that connect their view of its future revenue, earnings and margins to a financial forecast and, ultimately, a fair value estimate. On Simply Wall St’s Community page, millions of investors use Narratives to turn their perspective on a business into a structured forecast, then compare that Fair Value with the current share price to decide whether it looks like a buy, hold or sell. Because Narratives update dynamically when new earnings, news or guidance arrives, they stay relevant as the story evolves. For International Paper, for example, one investor might build a bullish Narrative around accelerating e commerce packaging demand, margin expansion from the $1.5 billion portfolio sale and a Fair Value well above today’s price. Another could create a more cautious Narrative that assumes slower 2.3% revenue growth, margins near 7% and a Fair Value closer to $48, illustrating how the same facts can lead to very different, but clearly quantified, conclusions.
Do you think there's more to the story for International Paper? Head over to our Community to see what others are saying!
This article by Simply Wall St is general in nature. We provide commentary based on historical data and analyst forecasts only using an unbiased methodology and our articles are not intended to be financial advice. It does not constitute a recommendation to buy or sell any stock, and does not take account of your objectives, or your financial situation. We aim to bring you long-term focused analysis driven by fundamental data. Note that our analysis may not factor in the latest price-sensitive company announcements or qualitative material. Simply Wall St has no position in any stocks mentioned.
Have feedback on this article? Concerned about the content? Get in touch with us directly. Alternatively, email editorial-team@simplywallst.com