
- LIVE QUOTES
- LEARN
- HELP
 Nasdaq
 Wall Street Journal
EN
Is There Still Opportunity in PBF Energy After Its Recent 30.5% Share Price Slump?
- If you are wondering whether PBF Energy is a bargain or a value trap at today’s price, you are not alone. This article will break down what the current market is really implying about the stock.
- After a 315.8% gain over the last 5 years, the shares have pulled back sharply, down 14.3% over the past week and 30.5% in the last month. The 1 year return still sits at 8.1%, and year to date performance is only a modest -2.8%.
- Recent headlines have focused on shifting sentiment toward refiners as crack spreads soften and energy markets digest changing demand expectations. This has made investors much more sensitive to swings in oil prices and macro data. At the same time, policy debates around fuel standards and long term energy transition plans have added an extra layer of uncertainty that helps explain why the market has been so quick to re rate the stock.
- On our framework, PBF Energy scores a 3 out of 6 valuation checks, suggesting pockets of undervaluation but not across the board. Next we will unpack what that means through different valuation lenses, before finishing with a more holistic way to think about what the company is really worth.
Approach 1: PBF Energy Discounted Cash Flow (DCF) Analysis
A Discounted Cash Flow model estimates what a company is worth by projecting the cash it can generate in the future and discounting those cash flows back to today. For PBF Energy, this 2 Stage Free Cash Flow to Equity model starts from the latest twelve month Free Cash Flow of roughly -$1.26 billion, highlighting how cyclical and capital intensive the refining business can be.
Analysts expect a sharp swing back to positive cash generation, with Free Cash Flow projected at about $292.7 million in 2026 and $82.3 million in 2027. Simply Wall St then extrapolates smaller and gradually declining cash flows through 2035. These future cash flows are discounted to their present value using an appropriate required return for equity investors.
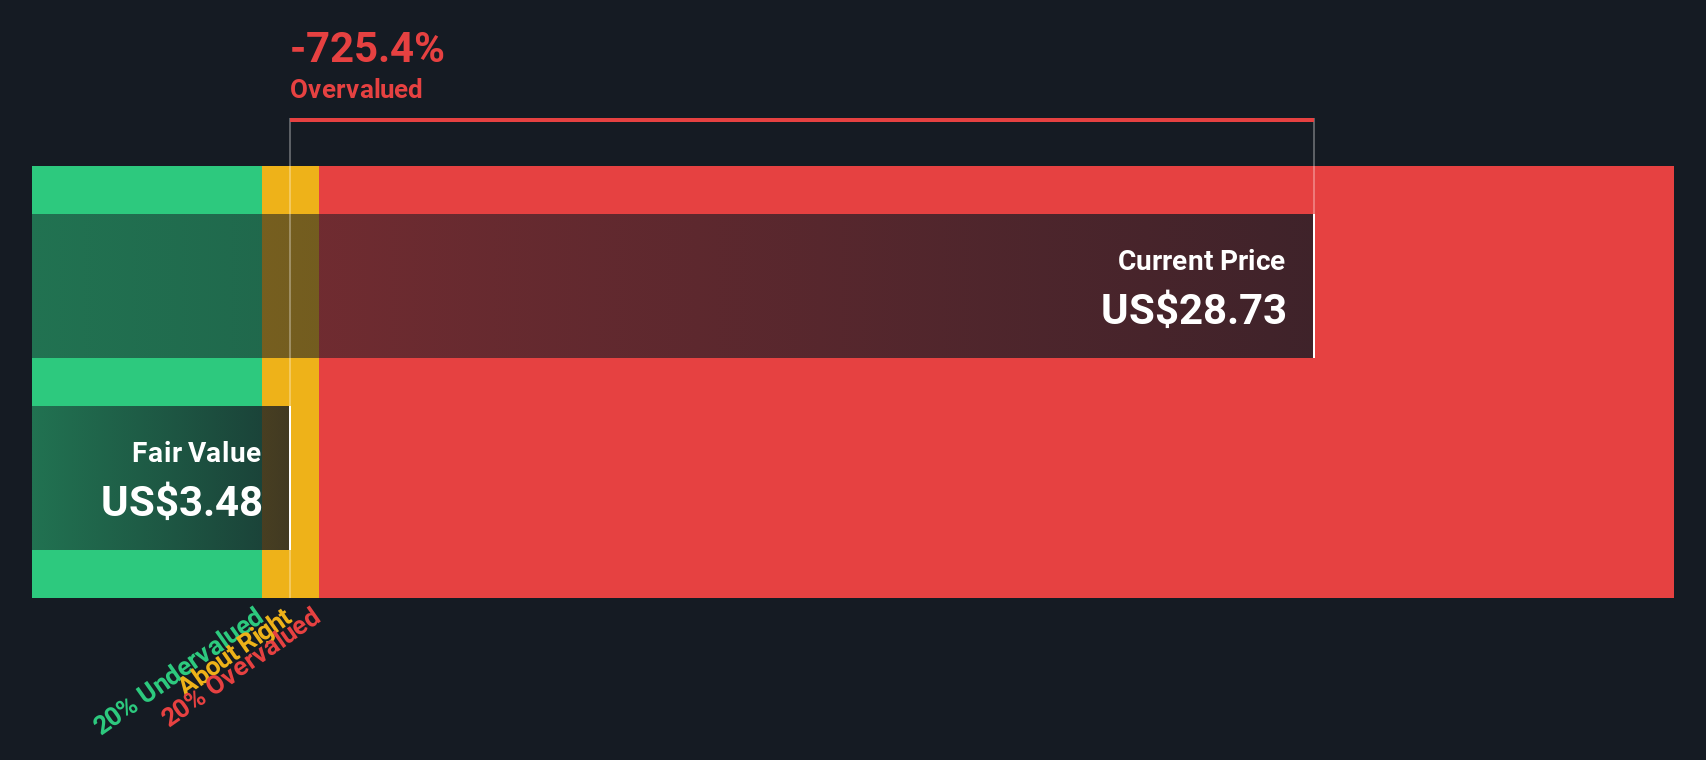
Putting all of this together, the DCF model implies an intrinsic value of about $3.76 per share. Compared to the current market price, this suggests PBF Energy is roughly 592.0% above its DCF based fair value, which points to material downside if these cash flow assumptions prove accurate.
Result: OVERVALUED
Our Discounted Cash Flow (DCF) analysis suggests PBF Energy may be overvalued by 592.0%. Discover 916 undervalued stocks or create your own screener to find better value opportunities.
Approach 2: PBF Energy Price vs Sales
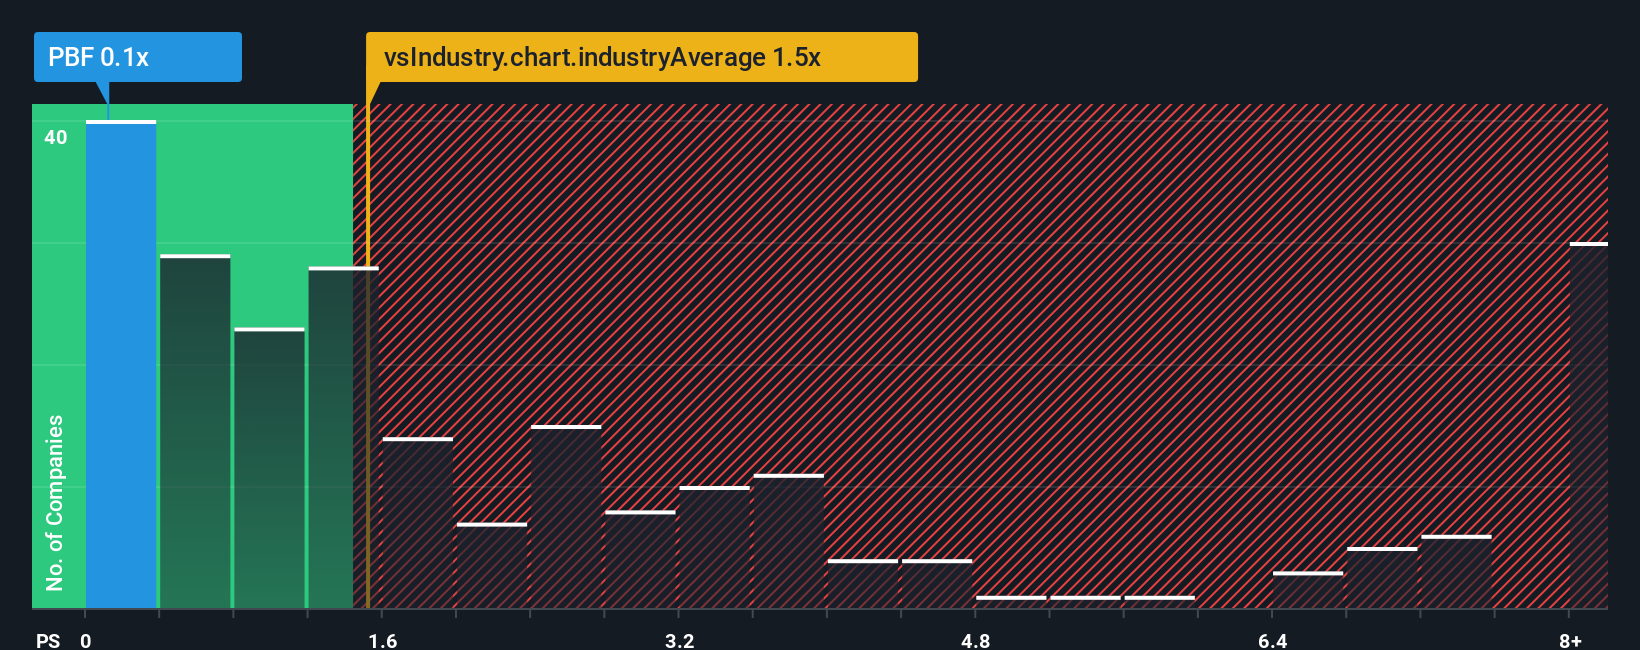
For asset heavy, cyclical refiners like PBF Energy, the price to sales ratio is often more informative than earnings based multiples, because revenue is typically more stable than profits, which can swing sharply with margins and commodity prices.
In general, investors are willing to pay a higher sales multiple for companies with stronger growth prospects and lower perceived risk. Slower growth or higher uncertainty usually justifies a lower, or even discounted, multiple. Against this backdrop, PBF Energy currently trades on a price to sales ratio of about 0.10x, which is well below both the Oil and Gas industry average of around 1.43x and the peer group average of roughly 0.31x.
Simply Wall St’s Fair Ratio framework goes a step further by estimating what a more appropriate multiple should be, given PBF Energy’s specific growth outlook, profitability profile, risk factors, size, and industry. On this basis, the Fair Ratio for PBF Energy is 0.43x, meaning the stock trades at a meaningful discount to where it might reasonably sit on fundamentals, even after considering its cyclicality and risks.
Result: UNDERVALUED
PS ratios tell one story, but what if the real opportunity lies elsewhere? Discover 1455 companies where insiders are betting big on explosive growth.
Upgrade Your Decision Making: Choose your PBF Energy Narrative
Earlier we mentioned that there is an even better way to understand valuation, so let us introduce you to Narratives, which are simply your story about a company, captured as assumptions about its future revenues, earnings, margins and, ultimately, fair value. A Narrative connects three pieces together in a structured way: the business story you believe, the financial forecast that flows from that story, and the fair value estimate those numbers imply. On Simply Wall St’s Community page, used by millions of investors, Narratives make this process accessible, allowing you to see and create clear, side by side views of different outlooks for PBF Energy and instantly compare each Narrative’s Fair Value to today’s share price to decide whether it looks like a buy, hold or sell. Narratives are also dynamic; they update as new earnings, news and guidance come in, so your view stays current rather than static. For example, one PBF Energy Narrative might lean bullish, assuming stronger crack spreads and landing near the higher fair value around $30.58, while another more cautious Narrative might focus on Martinez risks and long term fuel demand, aligning closer to the lower analyst view near $16, and the platform lets you weigh these perspectives against your own.
Do you think there's more to the story for PBF Energy? Head over to our Community to see what others are saying!
This article by Simply Wall St is general in nature. We provide commentary based on historical data and analyst forecasts only using an unbiased methodology and our articles are not intended to be financial advice. It does not constitute a recommendation to buy or sell any stock, and does not take account of your objectives, or your financial situation. We aim to bring you long-term focused analysis driven by fundamental data. Note that our analysis may not factor in the latest price-sensitive company announcements or qualitative material. Simply Wall St has no position in any stocks mentioned.
Have feedback on this article? Concerned about the content? Get in touch with us directly. Alternatively, email editorial-team@simplywallst.com