
- LIVE QUOTES
- LEARN
- HELP
 Nasdaq
 Wall Street Journal
EN
Is It Too Late To Consider Truist Financial After Its Strong 2024 Share Price Recovery?
- Wondering if Truist Financial is still a value play after its recent run, or if you are late to the party? This breakdown will help you decide whether the current price really makes sense.
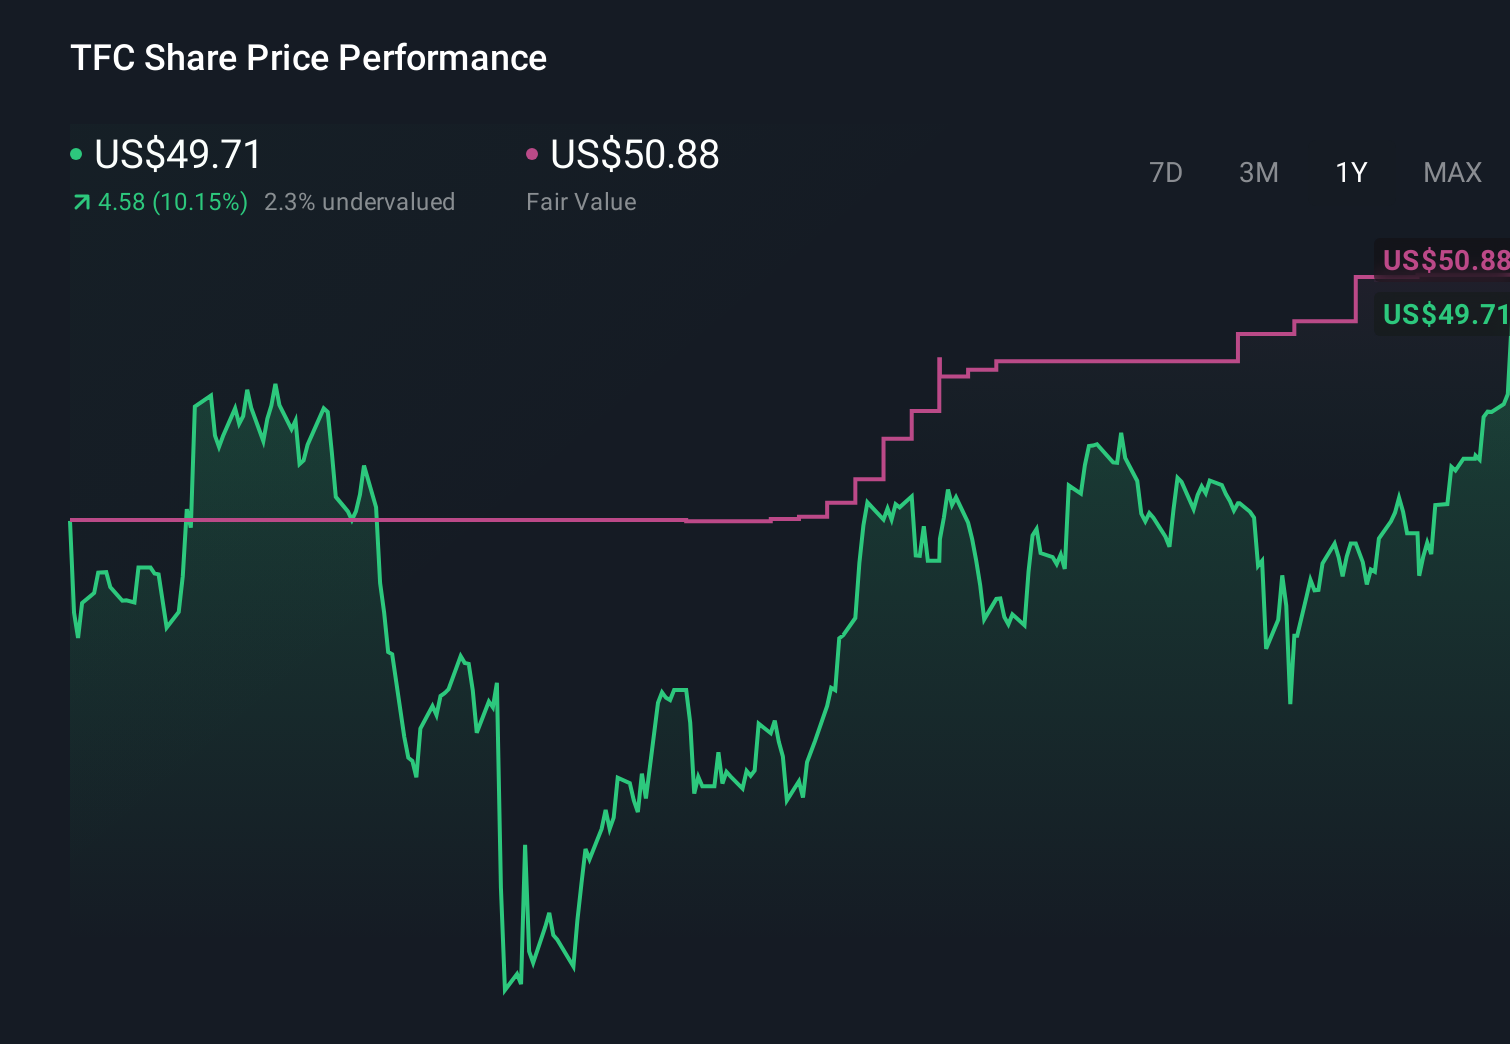
- The stock is up around 0.5% over the last week, 12.6% over the past month, and 23.2% in the last year, with longer term 3 year and 5 year returns of 38.4% and 34.3% that signal a meaningful recovery story taking shape.
- Recent headlines have focused on Truist reshaping its business mix, including strategic portfolio moves and ongoing cost efficiency efforts, which investors often interpret as management leaning into higher quality growth. At the same time, the broader banking sector has been repriced as markets reassess credit risk and the path of interest rates, which has supported sentiment toward Truist shares.
- Right now, Truist Financial scores a 3 out of 6 on our valuation checks, suggesting the market may be only partly recognizing its underlying value. Next we will unpack what different valuation methods say about that gap, before finishing with a more intuitive way to think about what the stock could really be worth.
Find out why Truist Financial's 23.2% return over the last year is lagging behind its peers.
Approach 1: Truist Financial Excess Returns Analysis
The Excess Returns model looks at how much profit Truist generates above the return investors require on its equity capital, then capitalizes that surplus into an intrinsic value per share.
For Truist, the starting point is a Book Value of $46.70 per share and a Stable EPS of $4.54 per share, based on weighted future Return on Equity estimates from 12 analysts. With an Average Return on Equity of 9.03% and a Cost of Equity of $4.12 per share, the bank is expected to earn an Excess Return of $0.42 per share, meaning it is generating more than the minimum return investors demand.
Analysts also see Stable Book Value rising to $50.24 per share, based on projections from 13 analysts, which supports a larger equity base earning these excess returns over time. When these excess profits are projected forward and discounted back, the model arrives at an intrinsic value of about $58.68 per share, implying the stock is roughly 14.9% undervalued versus the current market price.
In short, on this measure Truist still looks like a mispriced quality franchise rather than a fully valued turnaround.
Result: UNDERVALUED
Our Excess Returns analysis suggests Truist Financial is undervalued by 14.9%. Track this in your watchlist or portfolio, or discover 916 more undervalued stocks based on cash flows.

Approach 2: Truist Financial Price vs Earnings
For a consistently profitable bank like Truist, the price to earnings (PE) ratio is a useful yardstick because it directly links what investors pay for the stock to the earnings the business is generating today, while implicitly reflecting expectations for future growth and risk. In general, faster growth and lower perceived risk justify a higher PE multiple, while slower growth or higher risk should see the stock trade on a lower multiple.
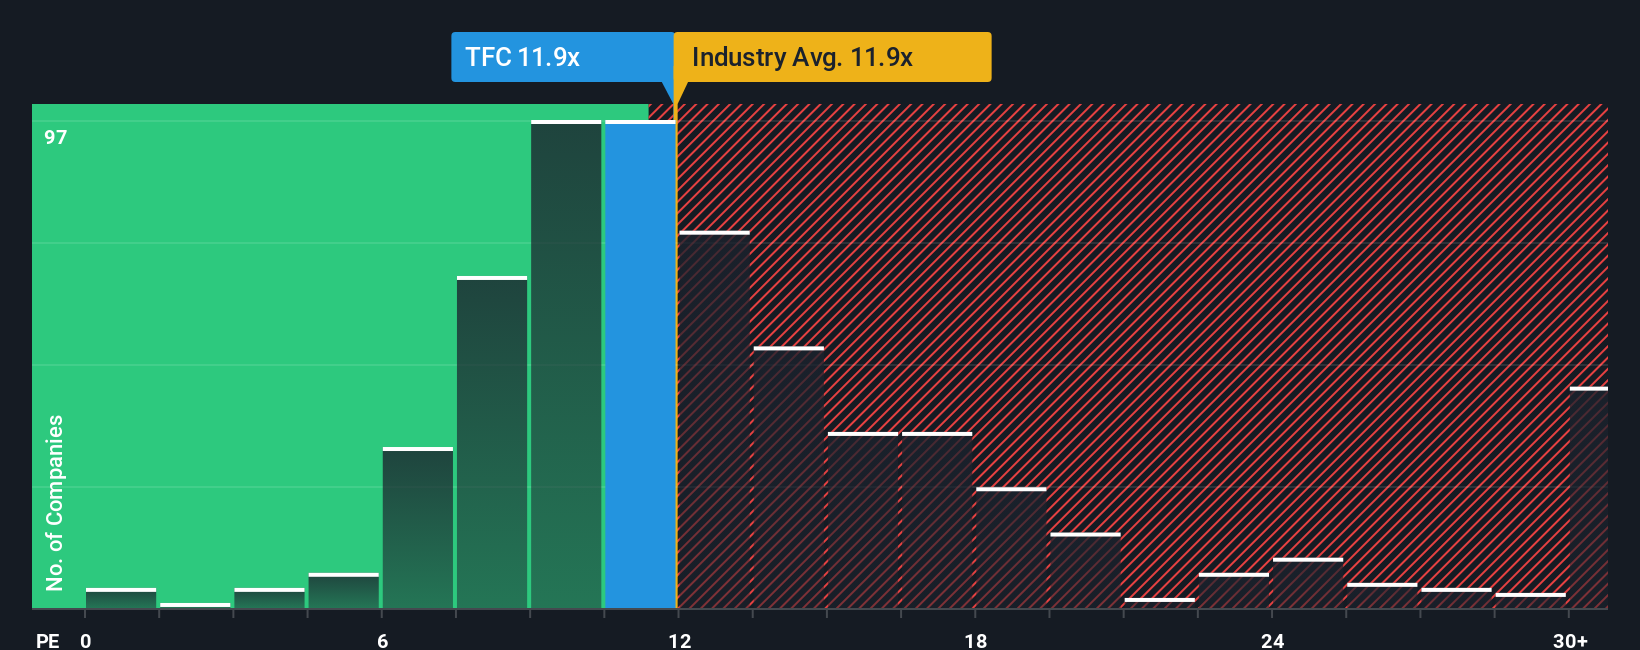
Truist currently trades on a PE of about 13.0x, slightly above the Banks industry average of roughly 12.0x and just below the peer group average of around 13.2x. Simply Wall St also calculates a proprietary “Fair Ratio” of 14.2x for Truist, which is the PE level you might expect given its specific mix of earnings growth prospects, profitability, size and risk profile.
This Fair Ratio is more tailored than a simple peer or industry comparison, because it adjusts for company level fundamentals rather than assuming all banks deserve the same multiple. With Truist’s actual PE sitting below this fair 14.2x level, the shares appear modestly undervalued on an earnings based view.
Result: UNDERVALUED on a PE basis
PE ratios tell one story, but what if the real opportunity lies elsewhere? Discover 1455 companies where insiders are betting big on explosive growth.
Upgrade Your Decision Making: Choose your Truist Financial Narrative
Earlier we mentioned that there is an even better way to understand valuation, so let us introduce you to Narratives, which are simple stories investors build around a company that connect their view of its future revenue, earnings and margins to a concrete fair value estimate. On Simply Wall St’s Community page, millions of investors use Narratives as an easy, accessible tool to spell out why they think a stock like Truist is attractive or risky, link that story to a forecast, and then compare their Fair Value to the current Price to decide whether to buy, hold or sell. Because Narratives are updated dynamically as new information such as earnings results, regulatory changes or product launches comes in, they stay aligned with the latest facts rather than going stale. For Truist Financial, for example, one optimistic Narrative might lean toward a higher fair value closer to about $55 per share based on the view that digital adoption, Sunbelt growth and cost discipline will keep lifting returns. A more cautious Narrative might anchor nearer $46 per share and focus on commercial real estate risks, branch cost drag and regulatory pressure.
Do you think there's more to the story for Truist Financial? Head over to our Community to see what others are saying!
This article by Simply Wall St is general in nature. We provide commentary based on historical data and analyst forecasts only using an unbiased methodology and our articles are not intended to be financial advice. It does not constitute a recommendation to buy or sell any stock, and does not take account of your objectives, or your financial situation. We aim to bring you long-term focused analysis driven by fundamental data. Note that our analysis may not factor in the latest price-sensitive company announcements or qualitative material. Simply Wall St has no position in any stocks mentioned.
Have feedback on this article? Concerned about the content? Get in touch with us directly. Alternatively, email editorial-team@simplywallst.com