
- LIVE QUOTES
- LEARN
- HELP
 Nasdaq
 Wall Street Journal
EN
Fabrinet (FN): Valuation Check After New Bullish Coverage and Growing AI Data Center Momentum
Fabrinet (FN) just got a fresh spotlight from both Wall Street and institutional investors, as Susquehanna initiated coverage with a Positive view and Wasatch strategies called out the stock as a key performance driver.
See our latest analysis for Fabrinet.
That renewed attention is landing on a stock that, despite a recent pullback reflected in a 7 day share price return of minus 14.33 percent, still shows powerful momentum with a year to date share price return of 105.32 percent and a 5 year total shareholder return of 494.95 percent. This suggests investors see Fabrinet’s board refresh, AI data center exposure, and optical networking strength as drivers of long term growth rather than a short lived story.
If Fabrinet’s run has you rethinking your tech exposure, this could be a moment to scout other high growth opportunities across high growth tech and AI stocks and see what else fits your portfolio’s next move.
With shares up more than 100 percent year to date and trading only modestly below analyst targets, investors now face the key question: Is Fabrinet still undervalued, or is the market already pricing in years of AI powered growth?
Most Popular Narrative: 5.6% Undervalued
With Fabrinet closing at $452.46 against a narrative fair value of $479.25, the current setup leans toward upside, if the growth path holds.
The decision to accelerate capacity expansion (Building 10) due to robust customer demand and new program ramps positions Fabrinet to capture additional large-scale opportunities in AI infrastructure and next-gen telecom. This is likely to support both sustained revenue growth and operating leverage as fixed costs are spread over higher output.
Curious how steady double digit growth, rising margins, and a richer future earnings multiple all fit together? The numbers behind this valuation might surprise you.
Result: Fair Value of $479.25 (UNDERVALUED)
Have a read of the narrative in full and understand what's behind the forecasts.
However, concentrated exposure to Nvidia and Cisco, along with ongoing supply chain bottlenecks in next gen transceivers, could quickly undermine the current upside case.
Find out about the key risks to this Fabrinet narrative.
Another Angle on Valuation
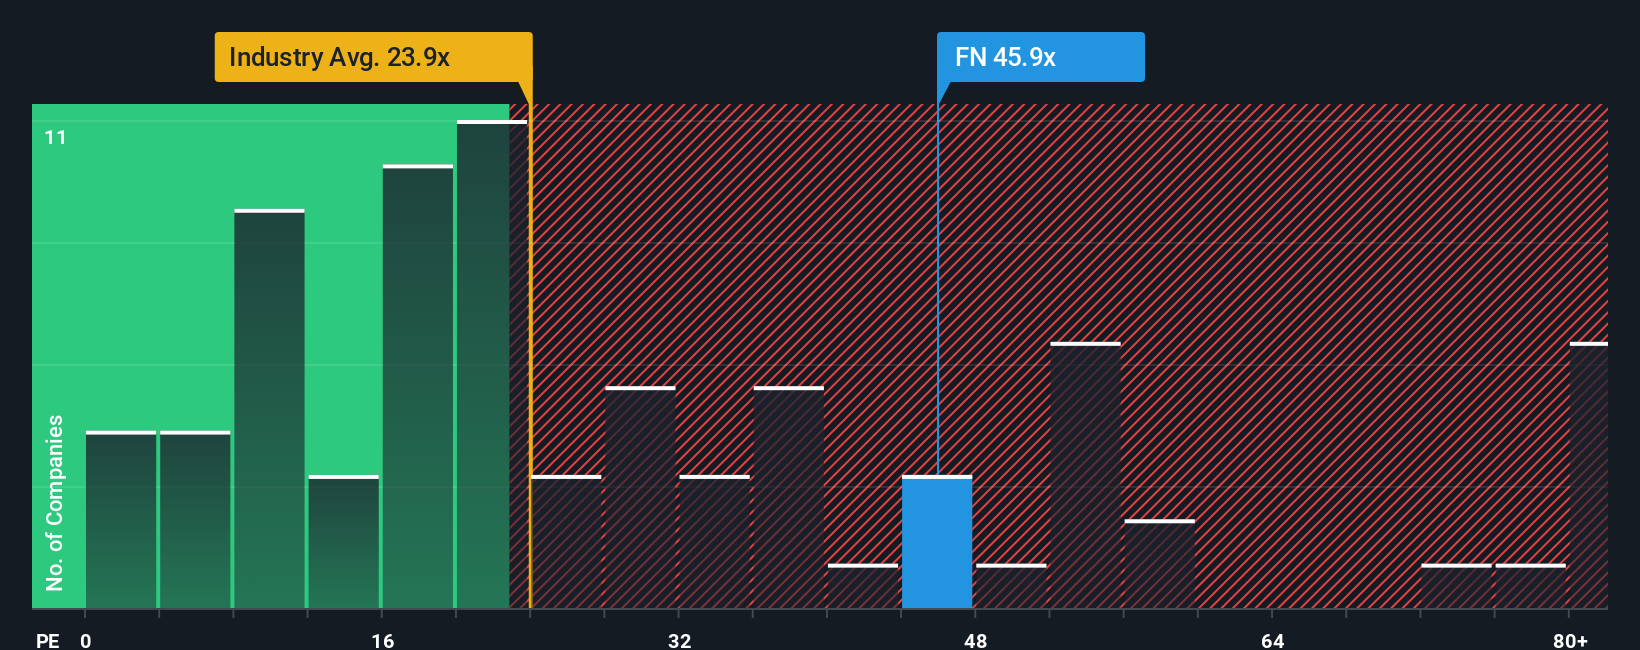
On a simple earnings lens, Fabrinet looks stretched. The current P E of 46.2 times sits well above the US Electronic industry at 24.1 times, the peer average at 36.1 times, and even our fair ratio of 34.6 times. This raises the question of how much future growth is already priced in.
See what the numbers say about this price — find out in our valuation breakdown.
Build Your Own Fabrinet Narrative
If you see the story differently or want to dig into the numbers yourself, you can shape a custom view in minutes: Do it your way.
A great starting point for your Fabrinet research is our analysis highlighting 2 key rewards and 1 important warning sign that could impact your investment decision.
Ready for your next investing move?
Use the Simply Wall St Screener to uncover fresh opportunities beyond Fabrinet, so you are not left watching from the sidelines while others act.
- Capture potential mispricings early by scanning these 918 undervalued stocks based on cash flows that show strong cash flow support but have yet to attract broad market attention.
- Ride the next wave of innovation by targeting these 24 AI penny stocks positioned at the heart of breakthroughs in automation, machine learning, and intelligent infrastructure.
- Lock in resilient income streams by focusing on these 13 dividend stocks with yields > 3% that can strengthen total returns through consistent cash payouts.
This article by Simply Wall St is general in nature. We provide commentary based on historical data and analyst forecasts only using an unbiased methodology and our articles are not intended to be financial advice. It does not constitute a recommendation to buy or sell any stock, and does not take account of your objectives, or your financial situation. We aim to bring you long-term focused analysis driven by fundamental data. Note that our analysis may not factor in the latest price-sensitive company announcements or qualitative material. Simply Wall St has no position in any stocks mentioned.
Have feedback on this article? Concerned about the content? Get in touch with us directly. Alternatively, email editorial-team@simplywallst.com