
- LIVE QUOTES
- LEARN
- HELP
 Nasdaq
 Wall Street Journal
EN
Assessing Vermilion Energy’s Valuation After 20% Slide Amid Sector Volatility
- Wondering if Vermilion Energy is a genuine bargain or a value trap at today’s price? Let us walk through what the numbers are really saying before you make up your mind.
- The stock has slipped recently, down about 6.3% over the last week, 11.5% over the last month, and nearly 19.7% year to date, even though it is still up 123.0% over five years.
- Those moves come against a backdrop of shifting sentiment in the energy sector, as investors weigh softer commodity prices against longer term demand for oil and gas. Vermilion has also been in focus as it continues to prioritize balance sheet strength and capital returns, which can change how the market prices its cash flows and risk.
- Despite the volatility, Vermilion scores a solid 5/6 on our valuation checks, which suggests it looks undervalued on most of the metrics we track. Next, we will break down those valuation approaches in detail and then finish with an even more practical way to think about what the stock might really be worth.
Find out why Vermilion Energy's -5.8% return over the last year is lagging behind its peers.
Approach 1: Vermilion Energy Discounted Cash Flow (DCF) Analysis
A Discounted Cash Flow model estimates what a business is worth by projecting the cash it can generate in the future and then discounting those cash flows back to today’s value. For Vermilion Energy, this 2 Stage Free Cash Flow to Equity model focuses on the cash available to shareholders after all expenses, interest, and necessary reinvestment.
Vermilion’s latest twelve month free cash flow was slightly negative at about CA$65 million, reflecting a period of heavier investment and volatile commodity prices. Analysts expect the company to return to positive territory, with projected free cash flow of roughly CA$203 million by 2029. Beyond the explicit analyst forecast window, Simply Wall St extrapolates further cash flows using conservative growth assumptions to build a full 10 year projection path.
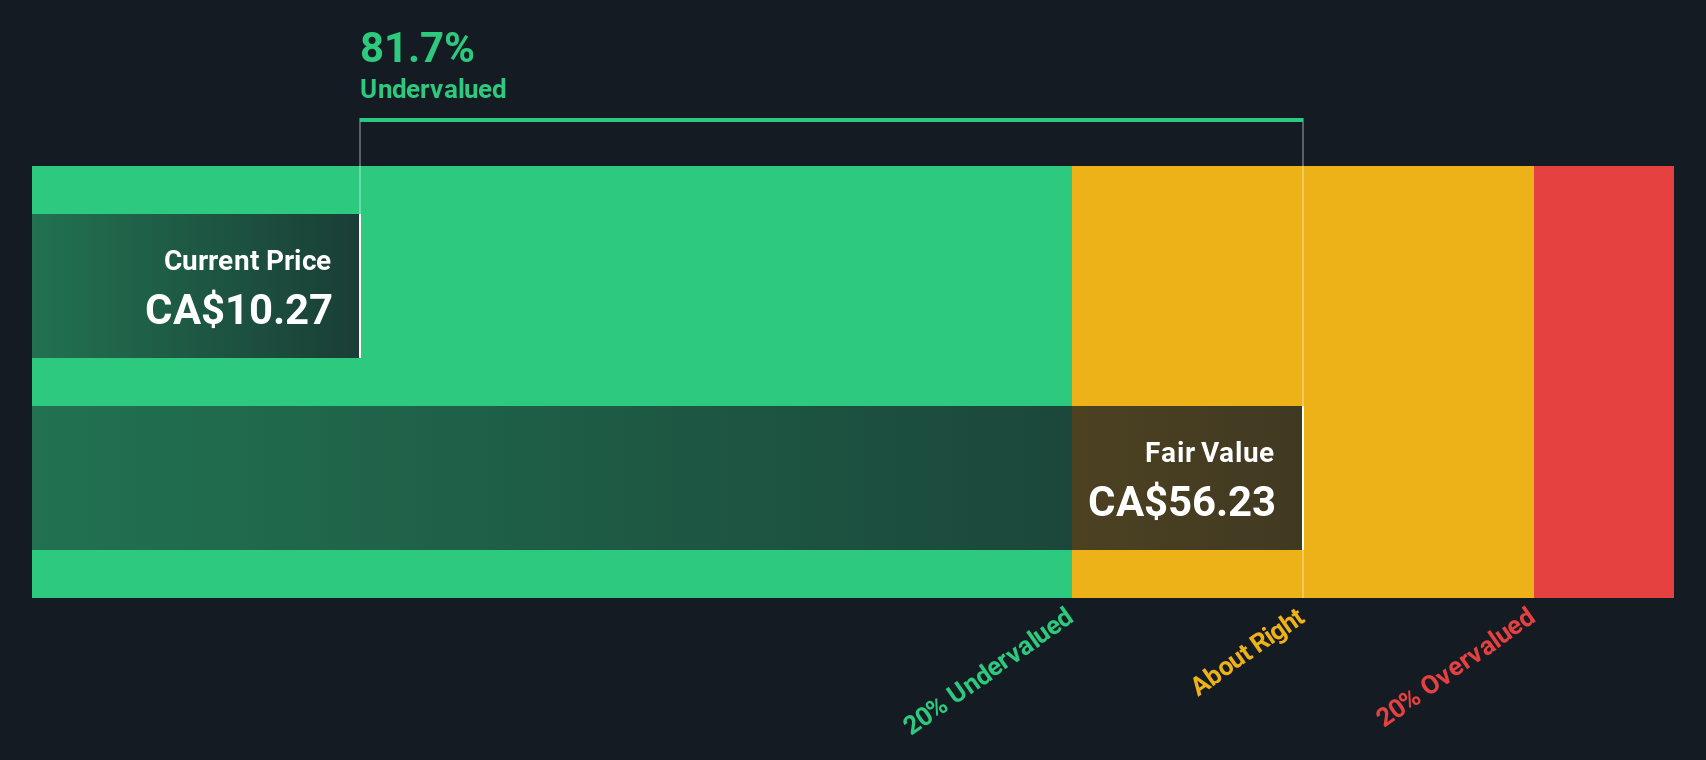
When these future CA$ cash flows are discounted back, the model arrives at an intrinsic value of roughly CA$29.08 per share. That indicates the stock is trading at around a 60.9% discount to its estimated fair value and suggests a substantial margin of safety for long term investors who are willing to accept commodity and execution risk.
Result: UNDERVALUED
Our Discounted Cash Flow (DCF) analysis suggests Vermilion Energy is undervalued by 60.9%. Track this in your watchlist or portfolio, or discover 917 more undervalued stocks based on cash flows.
Approach 2: Vermilion Energy Price vs Earnings
For companies that are consistently generating profits, the price to earnings ratio, or PE, is often the most intuitive way to think about valuation because it directly links what you pay for each share to the earnings that business is producing today. In general, faster growing and lower risk businesses deserve a higher “normal” PE, while slower growth and higher uncertainty should translate into a lower multiple.
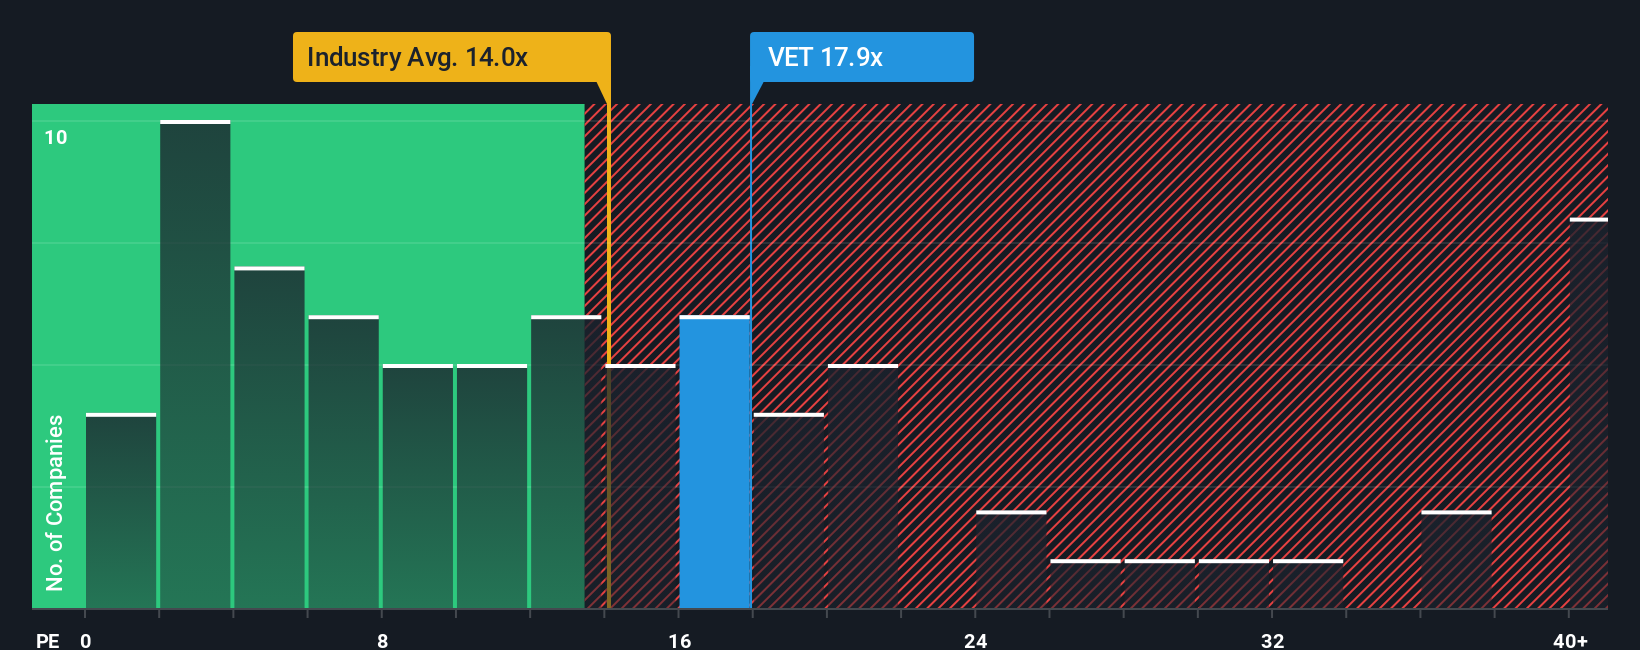
Vermilion currently trades on a PE of about 16.7x, which is above the Oil and Gas industry average of roughly 14.4x but below the broader peer group average around 23.7x. Simply Wall St’s proprietary Fair Ratio framework estimates what PE a company should trade on given its earnings growth, profitability, industry, size, and specific risks. For Vermilion, that Fair Ratio comes out at about 19.1x.
Because the Fair Ratio incorporates company specific factors rather than just broad comparisons, it can provide a more tailored benchmark than looking at industry or peers alone. On that basis, Vermilion’s current 16.7x PE sits below its 19.1x Fair Ratio, indicating the market is pricing the stock a little more cautiously than those fundamentals might justify.
Result: UNDERVALUED
PE ratios tell one story, but what if the real opportunity lies elsewhere? Discover 1456 companies where insiders are betting big on explosive growth.
Upgrade Your Decision Making: Choose your Vermilion Energy Narrative
Earlier we mentioned that there is an even better way to understand valuation, so now let us introduce Narratives, which are simply your story about a company, linked directly to your assumptions for its future revenue, earnings, margins, and ultimately its fair value. A Narrative on Simply Wall St connects three pieces in a straight line: what you think is happening in the business, what that means for a financial forecast, and what price per share would be reasonable if that story plays out. Narratives are easy to use within the Community page on Simply Wall St, where millions of investors share their views, compare Fair Value estimates to the current price to decide whether to buy, hold, or sell, and then see those views update dynamically as new news, earnings, or guidance is released. For Vermilion Energy, for example, one Narrative might lean bullish with a fair value near CA$17.00 based on rising European gas production and stronger margins, while a more cautious Narrative might see fair value closer to CA$10.50 because of execution, debt, and commodity risks. Your own view can sit anywhere along that spectrum.
Do you think there's more to the story for Vermilion Energy? Head over to our Community to see what others are saying!

This article by Simply Wall St is general in nature. We provide commentary based on historical data and analyst forecasts only using an unbiased methodology and our articles are not intended to be financial advice. It does not constitute a recommendation to buy or sell any stock, and does not take account of your objectives, or your financial situation. We aim to bring you long-term focused analysis driven by fundamental data. Note that our analysis may not factor in the latest price-sensitive company announcements or qualitative material. Simply Wall St has no position in any stocks mentioned.
Have feedback on this article? Concerned about the content? Get in touch with us directly. Alternatively, email editorial-team@simplywallst.com