
- LIVE QUOTES
- LEARN
- HELP
 Nasdaq
 Wall Street Journal
EN
General Mills (GIS) Q2 2026: 15.2% Net Margin Strengthens Bullish Valuation Narrative
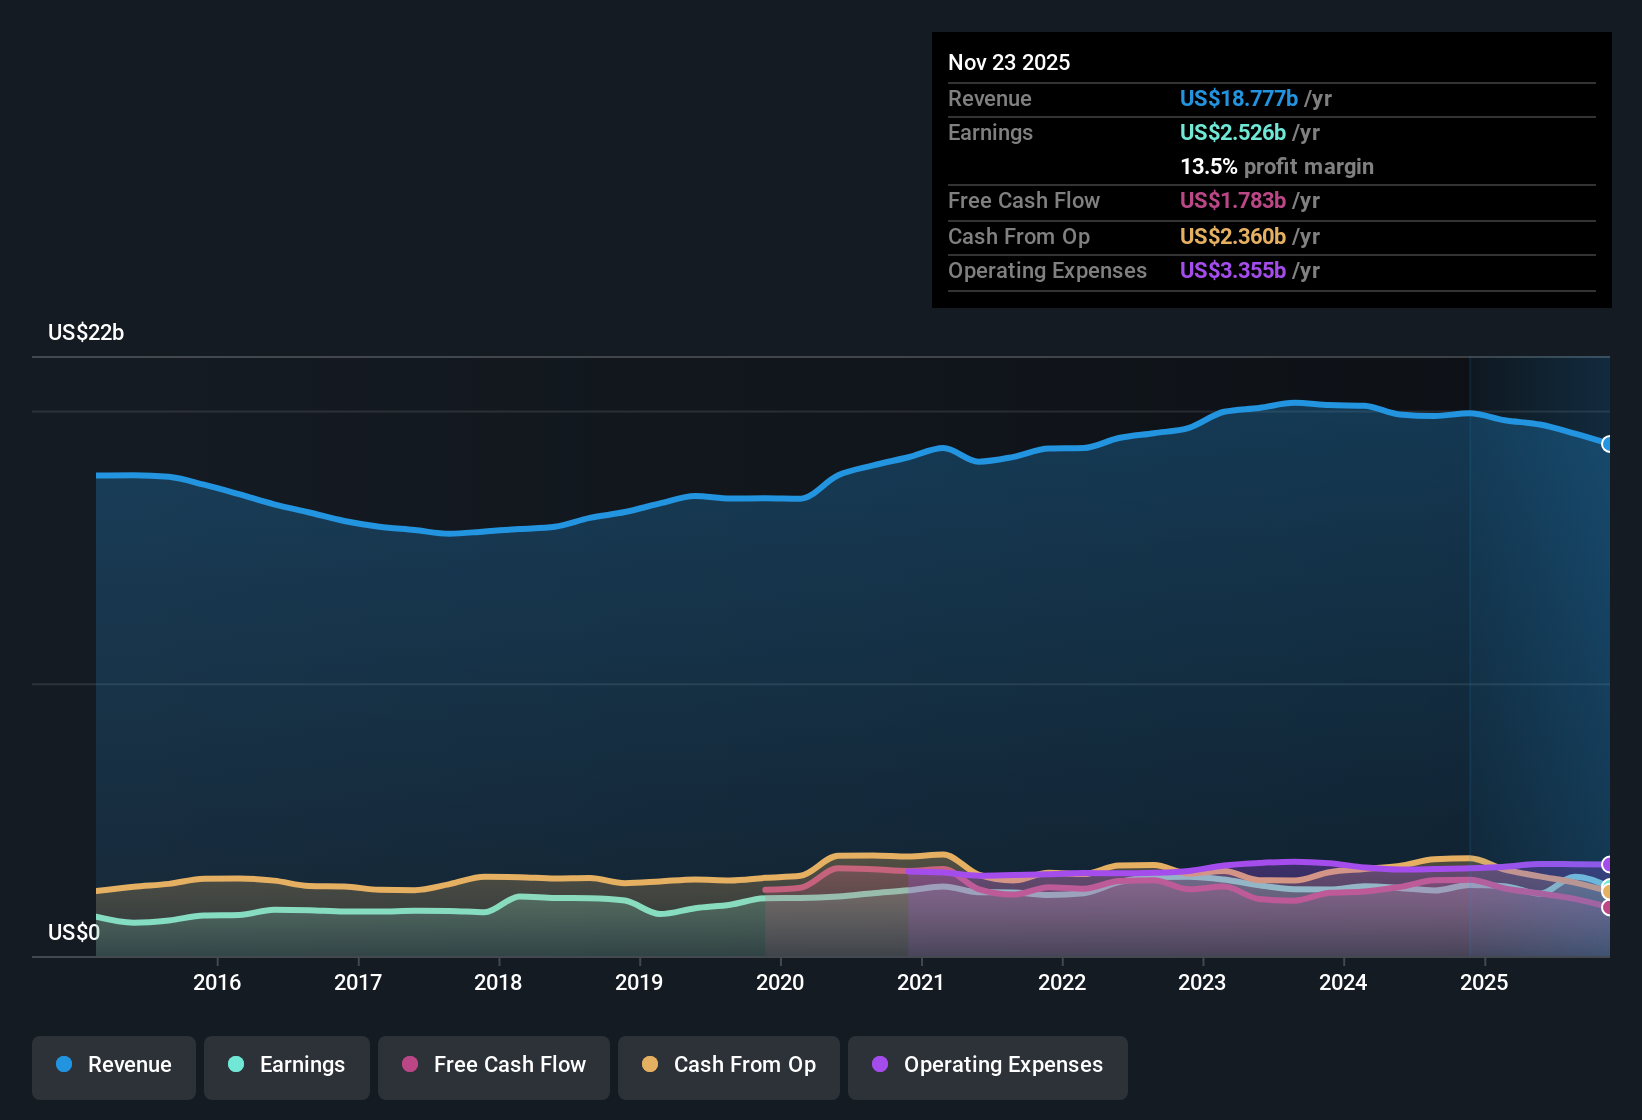
General Mills Q2 2026 Earnings at a Glance
General Mills (GIS) has just posted another set of solid numbers, with Q1 2026 revenue coming in at about $4.5 billion and basic EPS at $2.22. Trailing twelve month revenue and EPS stood at roughly $19.2 billion and $5.29 respectively, underpinning a 21% reported earnings lift over the past year. The company has seen revenue hover around the $19 billion mark over recent periods, while EPS has pushed up from $4.22 on a trailing basis in early 2025 to $5.29 by Q1 2026, pointing to healthier earnings power that now sits alongside a higher net margin profile.
See our full analysis for General Mills.With the headline figures on the table, the next step is to weigh them against the prevailing market and community narratives to see which stories the latest margins support and which assumptions might need a rethink.
See what the community is saying about General Mills
Margins Rise Faster Than Sales
- Trailing net profit margin improved to 15.2% from 12.1% over the last year, even though revenue only grew about 1.1% annually.
- What is interesting for the bullish side is that stronger margins today overlap with a reinvestment phase that management says may delay future margin gains:
- The consensus narrative expects margin pressure as General Mills steps up spending on pricing, innovation, and media. Yet the latest 15.2% margin is above last year’s 12.1% and above the 11.7% margin assumption baked into forward models.
- Bulls can point out that if margins are already at 15.2% while the company is reinvesting, then any payoff from these projects could help limit the margin shrink to the 11.0% level analysts are modeling over the next three years.
Valuation Looks Cheap Against DCF
- At a share price of $48.61, General Mills trades on a P/E of 8.9 times versus the US Food industry at 19.8 times and peers at 25.8 times, and sits far below the DCF fair value of $106.94.
- Consensus narrative watchers have to reconcile this discount with expectations for lower future earnings:
- Analysts are modeling earnings of about $2.1 billion in 2028, down from roughly $2.3 billion today. Yet to justify their implied 2028 price target of $52.63 they still assume a higher P/E of 15.8 times than today’s 8.9 times.
- This means bears citing cautious growth assumptions need to explain why the market is pricing the stock far below both the DCF fair value of $106.94 and the 15.8 times multiple analysts are using, despite only modest forecast declines in revenue and margins.
Debt Coverage Flags a Cash Risk
- One major risk highlighted is that debt is not well covered by operating cash flow, even though trailing net income is $2.9 billion helped by a $1.0 billion one off gain.
- Bears focus on this cash flow strain as a key challenge to the story of stability:
- Critics highlight that the 21% earnings growth and 15.2% net margin are flattered by the $1.0 billion one time gain, so they may not reflect the cash that will actually be available to handle debt in future years.
- When combined with analysts’ forecasts for revenues to decline 0.8% per year and margins to ease from 11.7% to 11.0%, skeptics argue it leaves less room for error if operating cash flow does not keep up with debt obligations.
Next Steps
To see how these results tie into long-term growth, risks, and valuation, check out the full range of community narratives for General Mills on Simply Wall St. Add the company to your watchlist or portfolio so you'll be alerted when the story evolves.
See the numbers differently? Take a few minutes to put that view into a structured story of your own. Start now with Do it your way.
A great starting point for your General Mills research is our analysis highlighting 4 key rewards and 2 important warning signs that could impact your investment decision.
Explore Alternatives
Despite resilient margins and a seemingly cheap valuation, General Mills faces weakening revenue forecasts and questionable cash coverage of debt once one off gains are stripped out.
If tightening cash flow and leverage bother you, act now and use our solid balance sheet and fundamentals stocks screener (1943 results) to identify financially sturdier companies that are better positioned to withstand pressure.
This article by Simply Wall St is general in nature. We provide commentary based on historical data and analyst forecasts only using an unbiased methodology and our articles are not intended to be financial advice. It does not constitute a recommendation to buy or sell any stock, and does not take account of your objectives, or your financial situation. We aim to bring you long-term focused analysis driven by fundamental data. Note that our analysis may not factor in the latest price-sensitive company announcements or qualitative material. Simply Wall St has no position in any stocks mentioned.
Have feedback on this article? Concerned about the content? Get in touch with us directly. Alternatively, email editorial-team@simplywallst.com