
- LIVE QUOTES
- LEARN
- HELP
 Nasdaq
 Wall Street Journal
EN
Positive week for The Hain Celestial Group, Inc. (NASDAQ:HAIN) institutional investors who lost 84% over the past year
Key Insights
- Given the large stake in the stock by institutions, Hain Celestial Group's stock price might be vulnerable to their trading decisions
- A total of 14 investors have a majority stake in the company with 52% ownership
- Insiders have bought recently
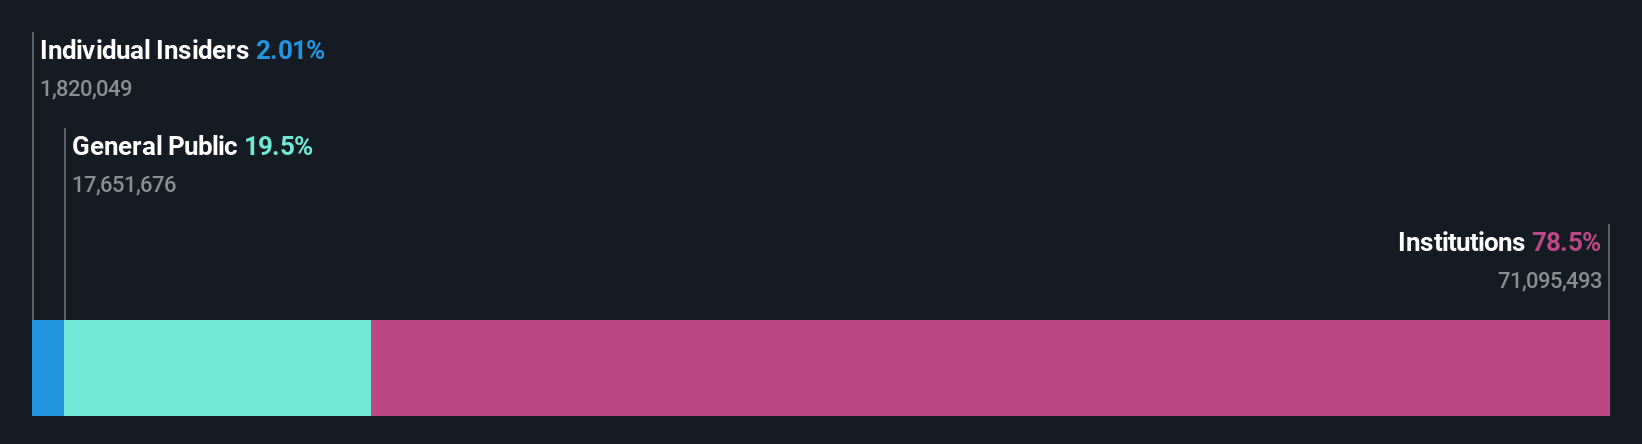
If you want to know who really controls The Hain Celestial Group, Inc. (NASDAQ:HAIN), then you'll have to look at the makeup of its share registry. And the group that holds the biggest piece of the pie are institutions with 79% ownership. In other words, the group stands to gain the most (or lose the most) from their investment into the company.
After a year of 84% losses, last week’s 11% gain would be welcomed by institutional investors as a possible sign that returns might start trending higher.
Let's take a closer look to see what the different types of shareholders can tell us about Hain Celestial Group.
Check out our latest analysis for Hain Celestial Group
What Does The Institutional Ownership Tell Us About Hain Celestial Group?
Institutions typically measure themselves against a benchmark when reporting to their own investors, so they often become more enthusiastic about a stock once it's included in a major index. We would expect most companies to have some institutions on the register, especially if they are growing.
We can see that Hain Celestial Group does have institutional investors; and they hold a good portion of the company's stock. This can indicate that the company has a certain degree of credibility in the investment community. However, it is best to be wary of relying on the supposed validation that comes with institutional investors. They too, get it wrong sometimes. It is not uncommon to see a big share price drop if two large institutional investors try to sell out of a stock at the same time. So it is worth checking the past earnings trajectory of Hain Celestial Group, (below). Of course, keep in mind that there are other factors to consider, too.

Investors should note that institutions actually own more than half the company, so they can collectively wield significant power. We note that hedge funds don't have a meaningful investment in Hain Celestial Group. Our data shows that The Vanguard Group, Inc. is the largest shareholder with 7.8% of shares outstanding. Meanwhile, the second and third largest shareholders, hold 7.4% and 4.8%, of the shares outstanding, respectively.
After doing some more digging, we found that the top 14 have the combined ownership of 52% in the company, suggesting that no single shareholder has significant control over the company.
Researching institutional ownership is a good way to gauge and filter a stock's expected performance. The same can be achieved by studying analyst sentiments. Quite a few analysts cover the stock, so you could look into forecast growth quite easily.
Insider Ownership Of Hain Celestial Group
The definition of company insiders can be subjective and does vary between jurisdictions. Our data reflects individual insiders, capturing board members at the very least. The company management answer to the board and the latter should represent the interests of shareholders. Notably, sometimes top-level managers are on the board themselves.
Insider ownership is positive when it signals leadership are thinking like the true owners of the company. However, high insider ownership can also give immense power to a small group within the company. This can be negative in some circumstances.
Shareholders would probably be interested to learn that insiders own shares in The Hain Celestial Group, Inc.. In their own names, insiders own US$2.0m worth of stock in the US$101m company. Some would say this shows alignment of interests between shareholders and the board, though we generally prefer to see bigger insider holdings. But it might be worth checking if those insiders have been selling.
General Public Ownership
The general public, who are usually individual investors, hold a 19% stake in Hain Celestial Group. While this size of ownership may not be enough to sway a policy decision in their favour, they can still make a collective impact on company policies.
Next Steps:
While it is well worth considering the different groups that own a company, there are other factors that are even more important. Case in point: We've spotted 1 warning sign for Hain Celestial Group you should be aware of.
If you would prefer discover what analysts are predicting in terms of future growth, do not miss this free report on analyst forecasts.
NB: Figures in this article are calculated using data from the last twelve months, which refer to the 12-month period ending on the last date of the month the financial statement is dated. This may not be consistent with full year annual report figures.
Have feedback on this article? Concerned about the content? Get in touch with us directly. Alternatively, email editorial-team (at) simplywallst.com.
This article by Simply Wall St is general in nature. We provide commentary based on historical data and analyst forecasts only using an unbiased methodology and our articles are not intended to be financial advice. It does not constitute a recommendation to buy or sell any stock, and does not take account of your objectives, or your financial situation. We aim to bring you long-term focused analysis driven by fundamental data. Note that our analysis may not factor in the latest price-sensitive company announcements or qualitative material. Simply Wall St has no position in any stocks mentioned.