
- LIVE QUOTES
- LEARN
- HELP
 Nasdaq
 Wall Street Journal
EN
Institutional investors have a lot riding on Irish Continental Group plc (LON:ICGC) with 37% ownership
Key Insights
- Given the large stake in the stock by institutions, Irish Continental Group's stock price might be vulnerable to their trading decisions
- A total of 4 investors have a majority stake in the company with 51% ownership
- Insiders have sold recently
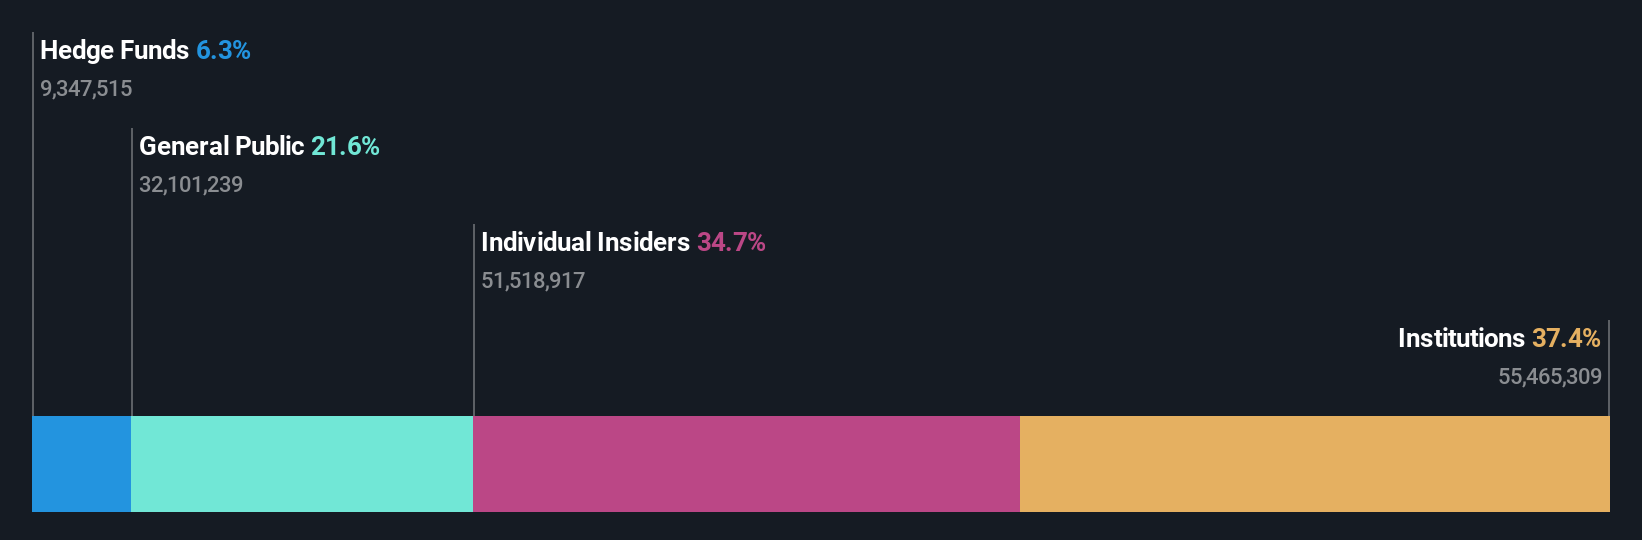
Every investor in Irish Continental Group plc (LON:ICGC) should be aware of the most powerful shareholder groups. The group holding the most number of shares in the company, around 37% to be precise, is institutions. Put another way, the group faces the maximum upside potential (or downside risk).
And things are looking up for institutional investors after the company gained UK£45m in market cap last week. The one-year return on investment is currently 25% and last week's gain would have been more than welcomed.
Let's take a closer look to see what the different types of shareholders can tell us about Irish Continental Group.
Check out our latest analysis for Irish Continental Group
What Does The Institutional Ownership Tell Us About Irish Continental Group?
Many institutions measure their performance against an index that approximates the local market. So they usually pay more attention to companies that are included in major indices.
As you can see, institutional investors have a fair amount of stake in Irish Continental Group. This suggests some credibility amongst professional investors. But we can't rely on that fact alone since institutions make bad investments sometimes, just like everyone does. If multiple institutions change their view on a stock at the same time, you could see the share price drop fast. It's therefore worth looking at Irish Continental Group's earnings history below. Of course, the future is what really matters.

Our data indicates that hedge funds own 6.3% of Irish Continental Group. That catches my attention because hedge funds sometimes try to influence management, or bring about changes that will create near term value for shareholders. Looking at our data, we can see that the largest shareholder is the CEO Eamonn Rothwell with 34% of shares outstanding. Kinney Asset Management, LLC. is the second largest shareholder owning 6.3% of common stock, and FMR LLC holds about 5.7% of the company stock.
Our research also brought to light the fact that roughly 51% of the company is controlled by the top 4 shareholders suggesting that these owners wield significant influence on the business.
While it makes sense to study institutional ownership data for a company, it also makes sense to study analyst sentiments to know which way the wind is blowing. While there is some analyst coverage, the company is probably not widely covered. So it could gain more attention, down the track.
Insider Ownership Of Irish Continental Group
While the precise definition of an insider can be subjective, almost everyone considers board members to be insiders. Management ultimately answers to the board. However, it is not uncommon for managers to be executive board members, especially if they are a founder or the CEO.
Insider ownership is positive when it signals leadership are thinking like the true owners of the company. However, high insider ownership can also give immense power to a small group within the company. This can be negative in some circumstances.
It seems insiders own a significant proportion of Irish Continental Group plc. It has a market capitalization of just UK£820m, and insiders have UK£285m worth of shares in their own names. That's quite significant. Most would be pleased to see the board is investing alongside them. You may wish to access this free chart showing recent trading by insiders.
General Public Ownership
With a 22% ownership, the general public, mostly comprising of individual investors, have some degree of sway over Irish Continental Group. This size of ownership, while considerable, may not be enough to change company policy if the decision is not in sync with other large shareholders.
Next Steps:
It's always worth thinking about the different groups who own shares in a company. But to understand Irish Continental Group better, we need to consider many other factors. Consider for instance, the ever-present spectre of investment risk. We've identified 2 warning signs with Irish Continental Group , and understanding them should be part of your investment process.
But ultimately it is the future, not the past, that will determine how well the owners of this business will do. Therefore we think it advisable to take a look at this free report showing whether analysts are predicting a brighter future.
NB: Figures in this article are calculated using data from the last twelve months, which refer to the 12-month period ending on the last date of the month the financial statement is dated. This may not be consistent with full year annual report figures.
Have feedback on this article? Concerned about the content? Get in touch with us directly. Alternatively, email editorial-team (at) simplywallst.com.
This article by Simply Wall St is general in nature. We provide commentary based on historical data and analyst forecasts only using an unbiased methodology and our articles are not intended to be financial advice. It does not constitute a recommendation to buy or sell any stock, and does not take account of your objectives, or your financial situation. We aim to bring you long-term focused analysis driven by fundamental data. Note that our analysis may not factor in the latest price-sensitive company announcements or qualitative material. Simply Wall St has no position in any stocks mentioned.