
- LIVE QUOTES
- LEARN
- HELP
 Nasdaq
 Wall Street Journal
EN
Is It Too Late To Consider Northrop Grumman After 21.5% Gains In 2025?
- If you are wondering whether Northrop Grumman at around $568 a share is still a smart buy, or if the big gains are already behind it, you are not alone. That is exactly what this breakdown will tackle.
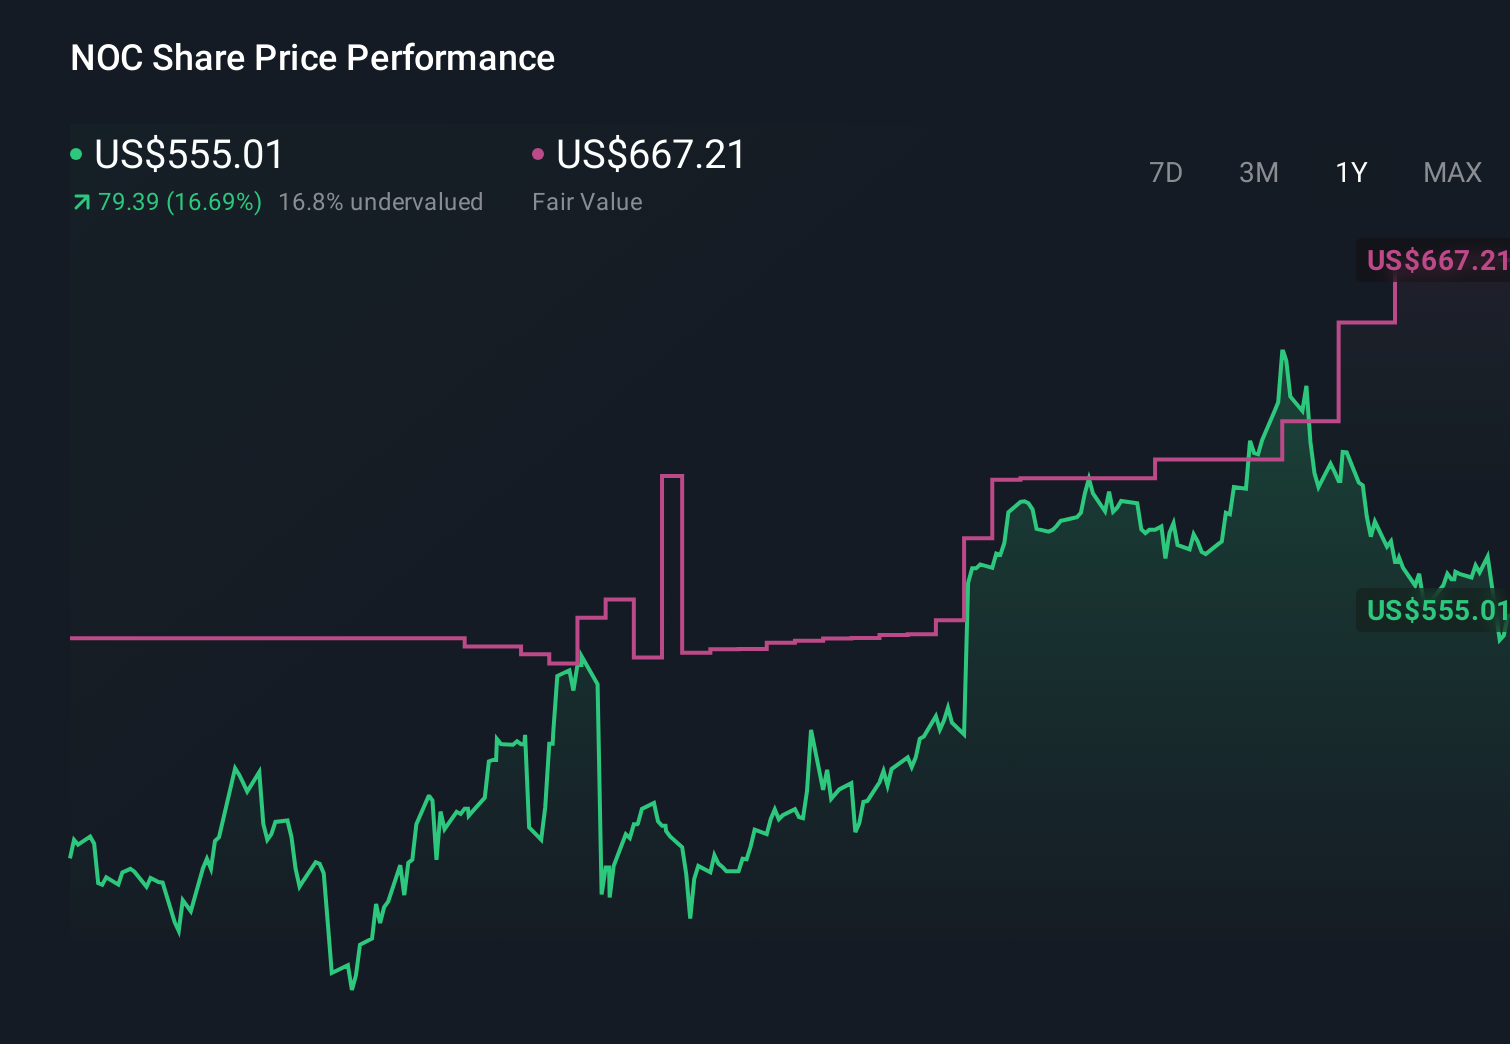
- The stock is up 3.3% over the last week, 1.9% over the past month, and 21.5% year to date, building on a 20.5% gain over the last year and 108.4% over five years.
- Recent headlines have focused on Northrop Grumman's expanding role in defense and space programs, including high profile contracts tied to missile defense, advanced aircraft, and classified systems. These stories have reinforced the market's view of NOC as a long term, mission critical defense player with solid growth visibility.
- Even with that backdrop, Northrop Grumman only scores a 3/6 valuation check score, which suggests the market may be paying up in some areas but not all. Next, we will unpack what different valuation approaches say about NOC, and then finish by looking at another way to think about its worth.
Find out why Northrop Grumman's 20.5% return over the last year is lagging behind its peers.
Approach 1: Northrop Grumman Discounted Cash Flow (DCF) Analysis
A Discounted Cash Flow model estimates what a company is worth today by projecting the cash it can generate in the future and then discounting those cash flows back to their present value. For Northrop Grumman, this approach uses a 2 stage Free Cash Flow to Equity model based on cash flow projections in $.
Northrop Grumman generated trailing twelve month free cash flow of about $1.75 billion, and analysts expect this to grow steadily as major defense and space programs ramp up. Simply Wall St incorporates analyst forecasts for the next several years, then extrapolates further out, with projected free cash flow rising to roughly $4.67 billion by 2035 as growth moderates over time.
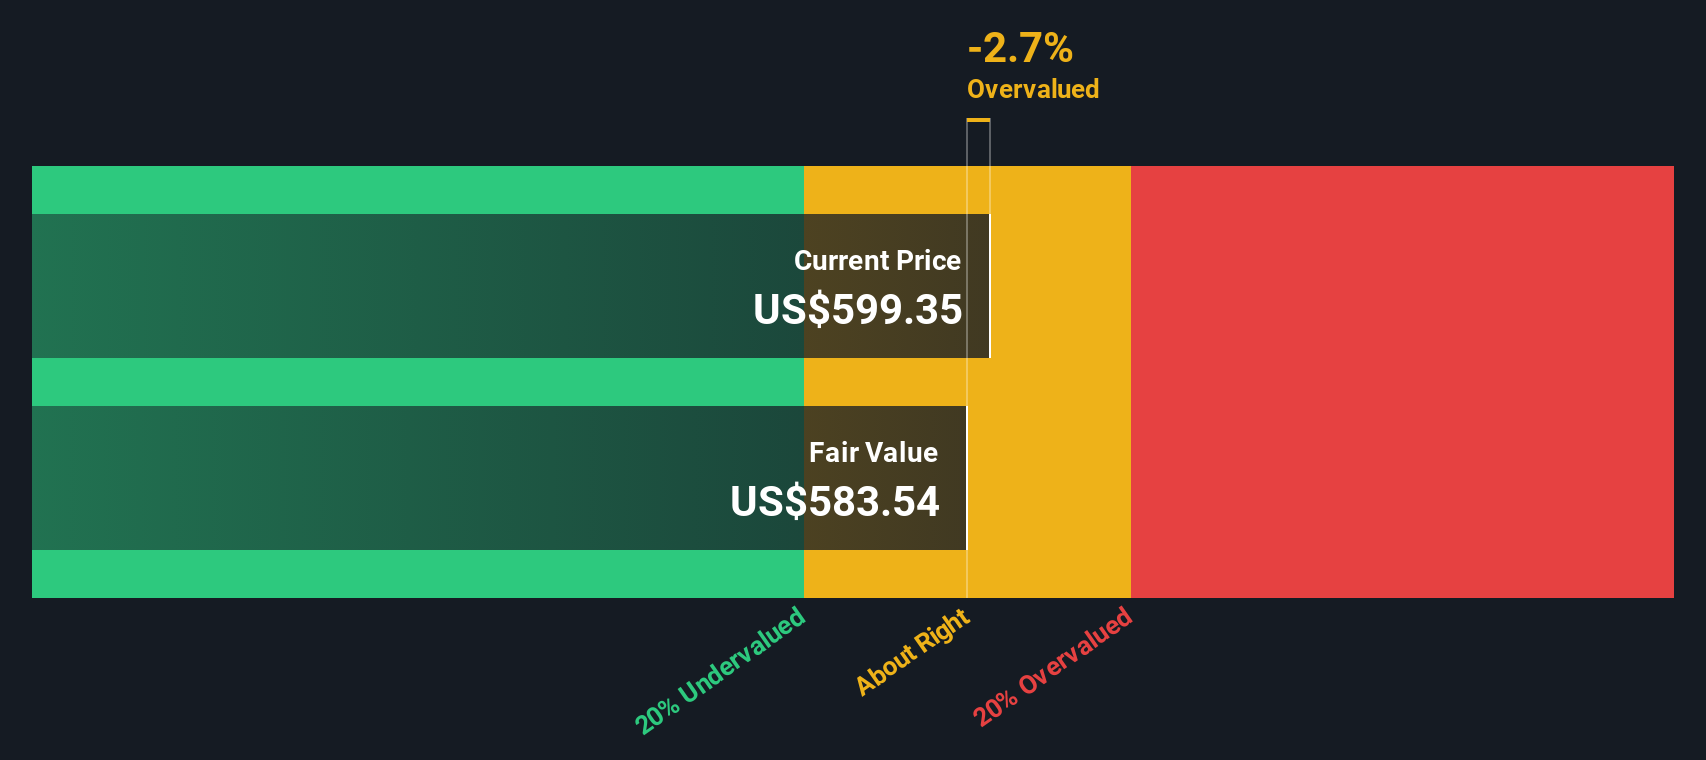
When all of these future cash flows are discounted back, the model arrives at an intrinsic value of about $520 per share. With the stock currently trading around $568, the DCF implies the shares are roughly 9.4% above this estimated fair value. This indicates that the market price already reflects a relatively optimistic outlook.
Result: ABOUT RIGHT
Northrop Grumman is fairly valued according to our Discounted Cash Flow (DCF), but this can change at a moment's notice. Track the value in your watchlist or portfolio and be alerted on when to act.
Approach 2: Northrop Grumman Price vs Earnings
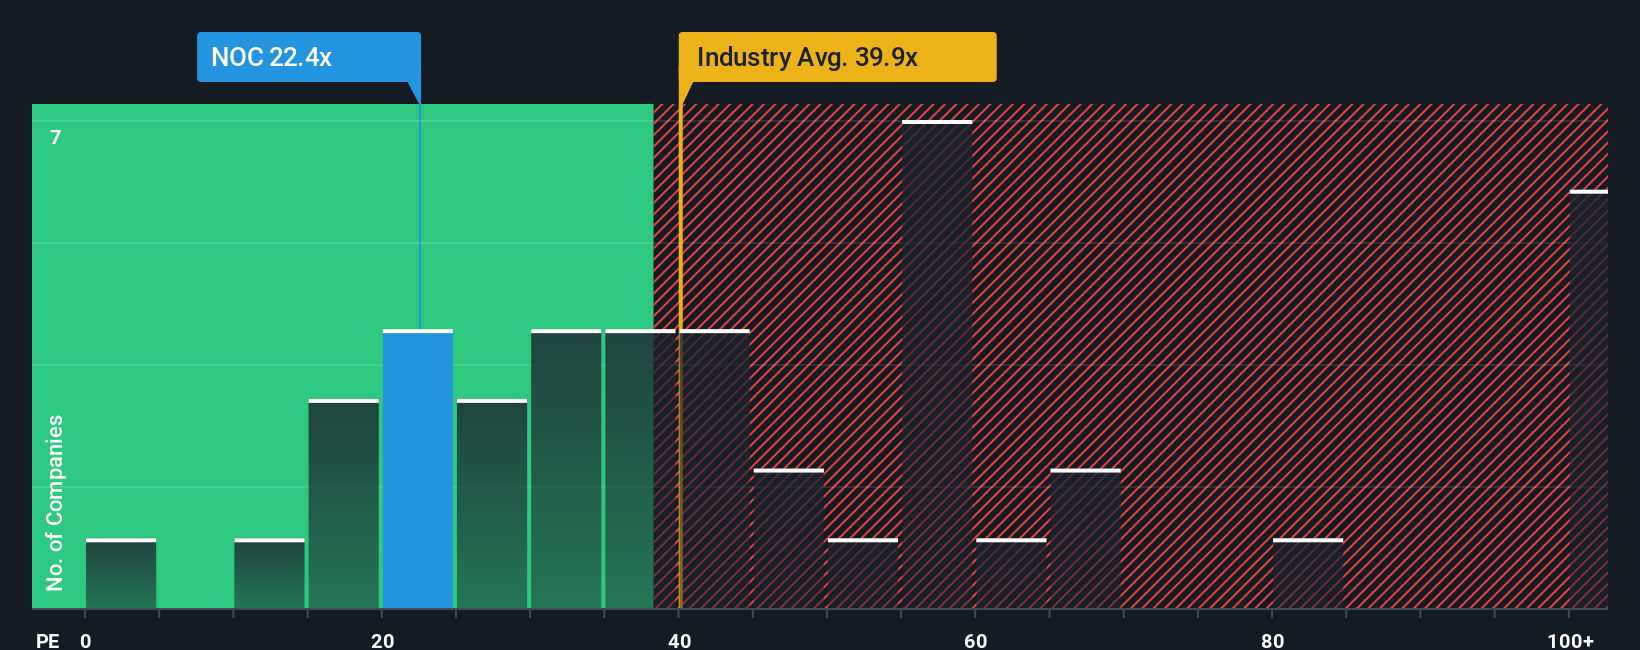
For established, profitable companies like Northrop Grumman, the Price to Earnings ratio is a practical way to gauge whether the market is paying a sensible price for each dollar of current earnings. Investors typically expect faster growing, lower risk businesses to justify a higher PE, while slower growing or riskier names should trade on a lower multiple.
Northrop Grumman currently trades on about 20.2x earnings, which is well below the Aerospace and Defense industry average of roughly 37.4x and also under the peer average of around 35.1x. To go a step further, Simply Wall St estimates a Fair Ratio of about 27.1x for Northrop Grumman. This proprietary metric reflects what a reasonable PE might be once earnings growth, profit margins, industry dynamics, company size, and risk profile are all factored in, rather than relying on blunt comparisons with peers.
Since the current 20.2x PE sits meaningfully below the 27.1x Fair Ratio, the shares appear attractively priced relative to what the fundamentals suggest investors might be willing to pay.
Result: UNDERVALUED
PE ratios tell one story, but what if the real opportunity lies elsewhere? Discover 1462 companies where insiders are betting big on explosive growth.
Upgrade Your Decision Making: Choose your Northrop Grumman Narrative
Earlier we mentioned that there is an even better way to understand valuation, so let us introduce you to Narratives, a simple way to turn your view of Northrop Grumman into a clear story that links what the company does, to a financial forecast, and then to a fair value estimate you can compare with the current share price on Simply Wall St’s Community page, used by millions of investors.
Do you think there's more to the story for Northrop Grumman? Head over to our Community to see what others are saying!
This article by Simply Wall St is general in nature. We provide commentary based on historical data and analyst forecasts only using an unbiased methodology and our articles are not intended to be financial advice. It does not constitute a recommendation to buy or sell any stock, and does not take account of your objectives, or your financial situation. We aim to bring you long-term focused analysis driven by fundamental data. Note that our analysis may not factor in the latest price-sensitive company announcements or qualitative material. Simply Wall St has no position in any stocks mentioned.
Have feedback on this article? Concerned about the content? Get in touch with us directly. Alternatively, email editorial-team@simplywallst.com