
- LIVE QUOTES
- LEARN
- HELP
 Nasdaq
 Wall Street Journal
EN
Is Gilead Sciences Still Attractive After Its 2025 Surge and Oncology Pipeline Momentum
- If you are wondering whether Gilead Sciences is still a smart consideration after its big run, or if you are late to the party, this breakdown will help you assess whether the current price makes sense or is quietly offering value.
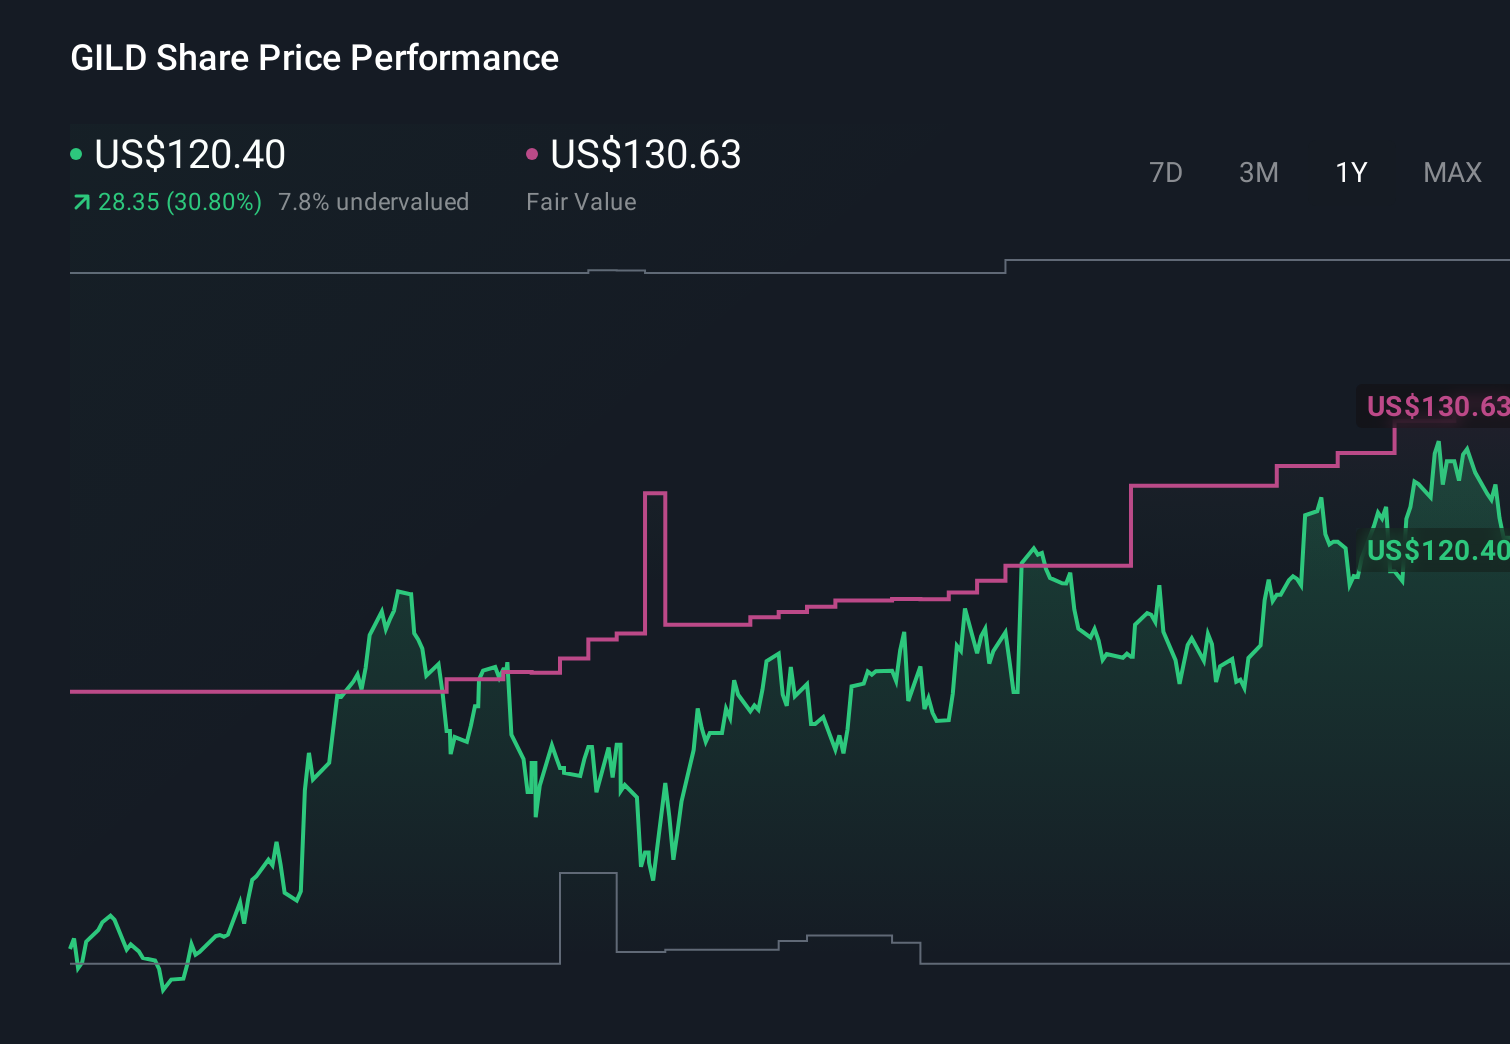
- The stock is flat over the last week and down 2.2% over the past month, but it is still up 32.1% year to date and 156.3% over five years, which indicates that sentiment has shifted in a significant way.
- Recent headlines have focused on Gilead's expanding oncology pipeline and strategic collaborations in HIV and viral therapies. This reinforces the idea that its late stage assets could be important drivers of future growth. At the same time, regulatory updates and product approvals have kept the spotlight on how durable its cash flows might be in a more competitive landscape.
- Within our framework, Gilead scores a 5/6 valuation check, suggesting it appears undervalued on most measures. In the next sections we will unpack those methods, then finish with an intuitive way to think about what this valuation could mean for long term investors.
Approach 1: Gilead Sciences Discounted Cash Flow (DCF) Analysis
A Discounted Cash Flow model estimates what a business is worth by projecting the cash it can generate in the future and discounting those cash flows back to today in $ terms.
For Gilead Sciences, the latest twelve month free cash flow is about $9.1 billion, providing a substantial base of cash generation. Analysts expect free cash flow to rise steadily, with projections and extrapolations indicating it could reach roughly $17.7 billion by 2035. The model used here is a 2 Stage Free Cash Flow to Equity approach, where the first stage relies on analyst forecasts and the second stage continues with more moderate growth assumptions generated by Simply Wall St.
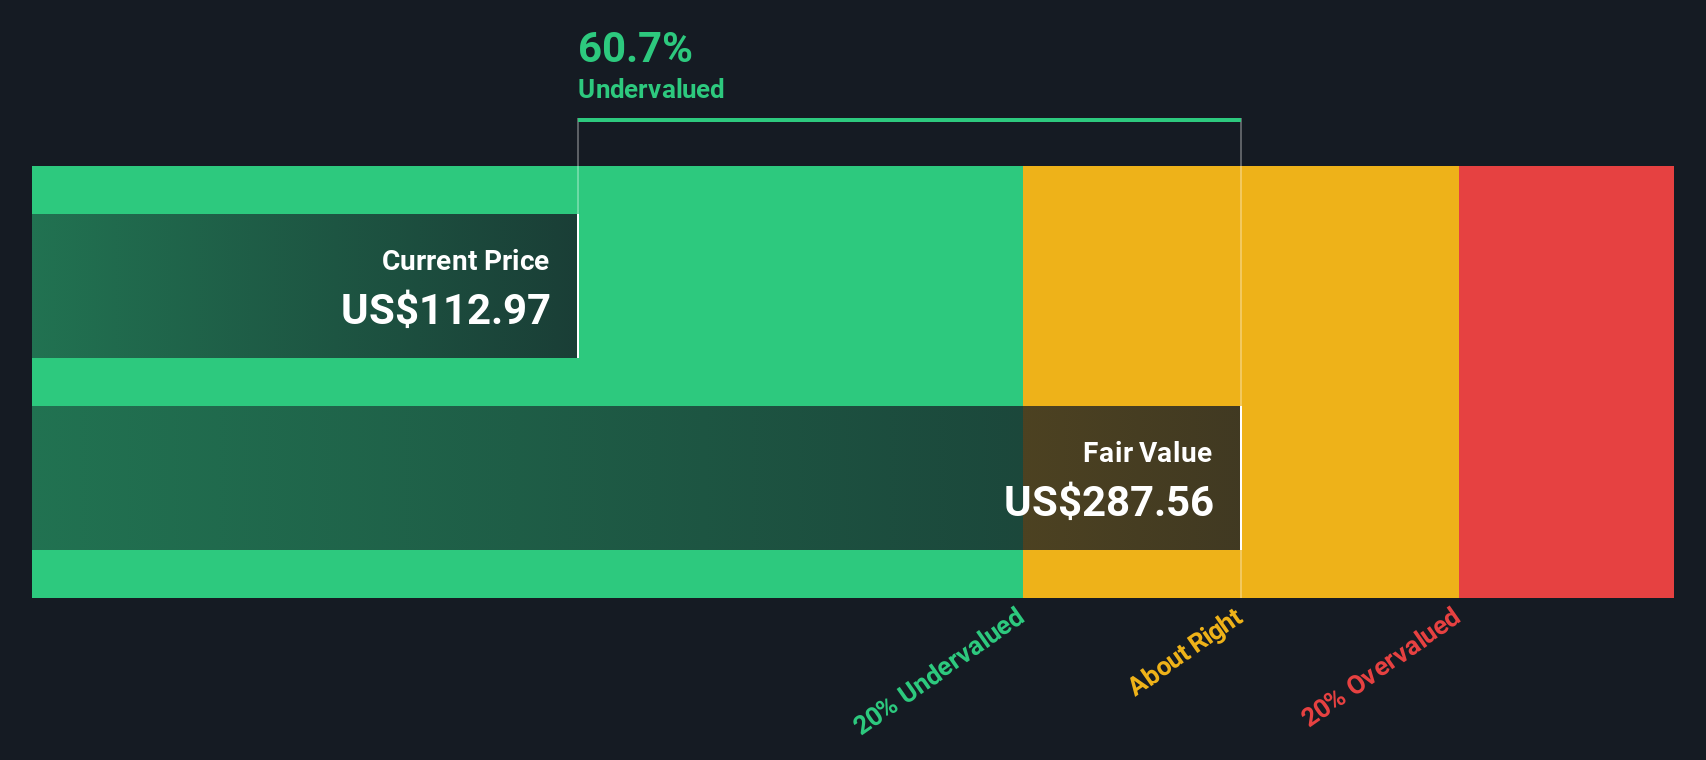
Based on these cash flow projections, the DCF model arrives at an estimated intrinsic value of about $260.39 per share. Compared with the current market price, this implies the stock trades at roughly a 53.4% discount to its calculated fair value, which suggests the market is not fully pricing in Gilead's future cash generating potential.
Result: UNDERVALUED
Our Discounted Cash Flow (DCF) analysis suggests Gilead Sciences is undervalued by 53.4%. Track this in your watchlist or portfolio, or discover 912 more undervalued stocks based on cash flows.
Approach 2: Gilead Sciences Price vs Earnings
The price to earnings ratio is a useful yardstick for valuing established, profitable companies because it links what investors pay today to the earnings the business is already generating. In general, faster growing and less risky companies justify a higher PE, while slower growing or riskier firms tend to trade on lower multiples.
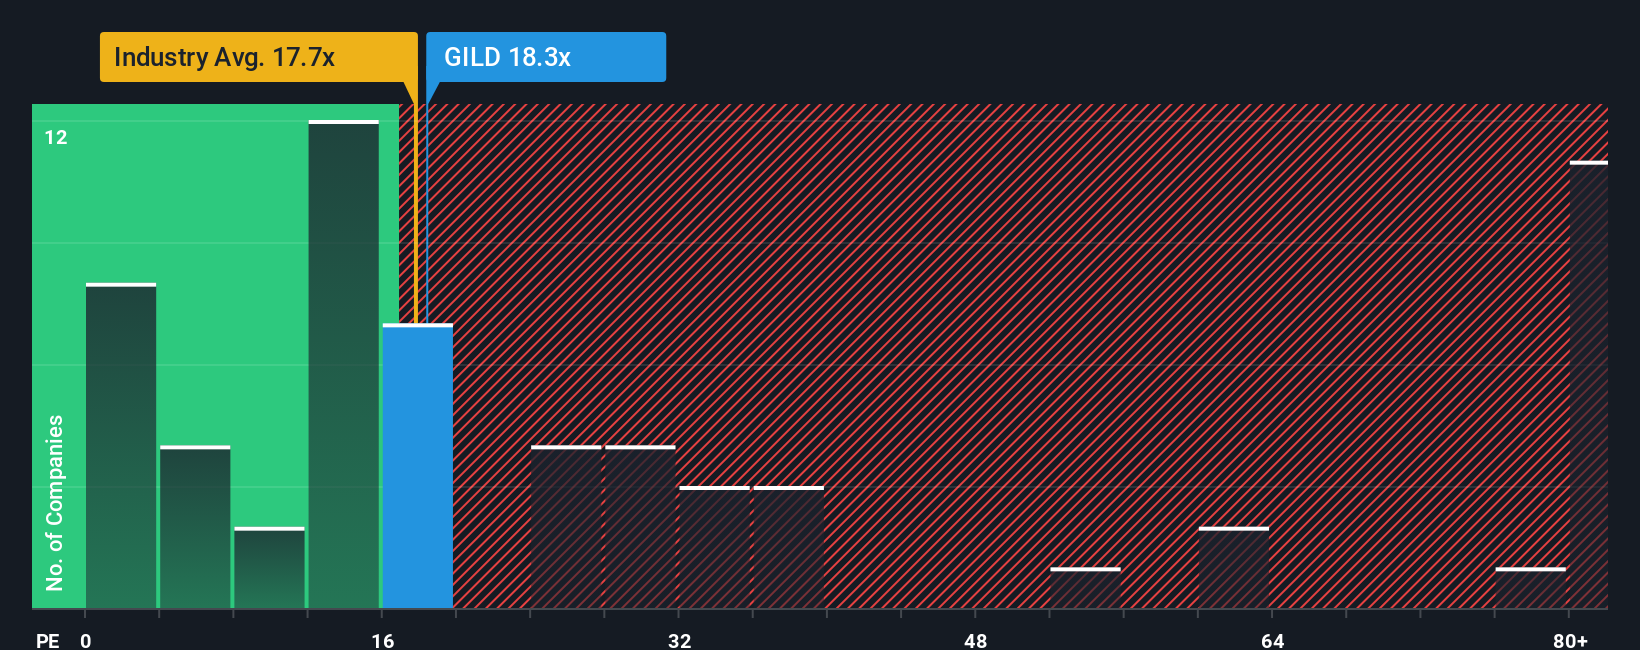
Gilead currently trades on a PE of about 18.6x, which is roughly in line with the Biotechs industry average of around 18.6x, but well below the broader peer group average of about 60.4x. To go a step further, Simply Wall St estimates a Fair Ratio of roughly 28.1x for Gilead, based on a proprietary model that blends earnings growth, industry positioning, profit margins, company size and specific risk factors.
This Fair Ratio provides a more tailored benchmark than a simple comparison with peers or the industry, because it adjusts for the characteristics that are unique to Gilead. With the current PE sitting meaningfully below the Fair Ratio, the multiple-based view points to the shares trading at a discount to what would be considered a reasonable valuation.
Result: UNDERVALUED
PE ratios tell one story, but what if the real opportunity lies elsewhere? Discover 1462 companies where insiders are betting big on explosive growth.
Upgrade Your Decision Making: Choose your Gilead Sciences Narrative
Earlier we mentioned that there is an even better way to understand valuation, so let us introduce you to Narratives, a simple way to attach your own story about Gilead Sciences to the numbers behind its fair value, future revenue, earnings and margins. A Narrative is your view of how the business will actually evolve, linked directly to a financial forecast and then to a fair value estimate, so you are not just copying analyst targets; you are encoding your expectations and seeing what they imply. On Simply Wall St, Narratives live in the Community page and are used by millions of investors. This makes them an easy and accessible tool to explore different scenarios, compare Fair Value to the current share price, and decide whether that means buy, hold or sell for you. Because Narratives are updated dynamically as new earnings, news and regulatory developments come through, your fair value view does not go stale when the story changes. For example, one investor might build a more cautious Gilead Sciences Narrative anchored near the low end of analyst targets around $91, while another leans into a more optimistic path closer to $140, reflecting stronger HIV and oncology momentum.
Do you think there's more to the story for Gilead Sciences? Head over to our Community to see what others are saying!
This article by Simply Wall St is general in nature. We provide commentary based on historical data and analyst forecasts only using an unbiased methodology and our articles are not intended to be financial advice. It does not constitute a recommendation to buy or sell any stock, and does not take account of your objectives, or your financial situation. We aim to bring you long-term focused analysis driven by fundamental data. Note that our analysis may not factor in the latest price-sensitive company announcements or qualitative material. Simply Wall St has no position in any stocks mentioned.
Have feedback on this article? Concerned about the content? Get in touch with us directly. Alternatively, email editorial-team@simplywallst.com