
- LIVE QUOTES
- LEARN
- HELP
 Nasdaq
 Wall Street Journal
EN
Is CBIZ Now an Opportunity After 34% Share Price Slide and Cash Flow Outlook?
- Wondering if CBIZ is quietly setting up as a value play while the market is distracted elsewhere? Let us unpack what the current price is really implying about its future.
- CBIZ just closed at $53.49, and while it is up 5.6% over the past week and 4.6% over the last month, the stock is still down about 34.1% year to date and 34.5% over the past year, giving it a mixed performance profile that value focused investors tend to notice.
- Behind those swings, investors have been reacting to a steady drumbeat of updates around CBIZ's advisory and risk services business, along with ongoing commentary about demand for outsourced tax and consulting support as clients navigate a tougher macro environment. The narrative in recent months has largely centered on how resilient those recurring service lines can be, and whether CBIZ can keep expanding margins even as growth normalizes.
- Right now, CBIZ scores a 4 out of 6 on our valuation checks, suggesting the market may be underestimating its fundamentals in several key areas, but not across the board. Next, we will walk through what different valuation approaches say about that score, and then finish with a more complete way to think about CBIZ's true worth that goes beyond any single model.
Find out why CBIZ's -34.5% return over the last year is lagging behind its peers.
Approach 1: CBIZ Discounted Cash Flow (DCF) Analysis
A Discounted Cash Flow, or DCF, model estimates what a business is worth today by projecting the cash it can generate in the future and discounting those cash flows back to the present.
For CBIZ, the model starts with last twelve month free cash flow of about $80.1 million in $ and then applies a two stage Free Cash Flow to Equity framework. Analysts provide detailed forecasts for the next few years, with free cash flow expected to climb toward roughly $340.7 million by 2027. After that point, Simply Wall St extrapolates the next decade of cash flows, rising to about $478.6 million by 2035 based on more moderate growth assumptions.
When all of these projected cash flows are discounted back to today, the DCF model arrives at an intrinsic value of roughly $128.00 per share, compared with the recent share price of $53.49. That implies CBIZ is trading at about a 58.2% discount to its estimated fair value. This suggests the market is pricing in a much weaker future than the cash flow profile indicates.
Result: UNDERVALUED
Our Discounted Cash Flow (DCF) analysis suggests CBIZ is undervalued by 58.2%. Track this in your watchlist or portfolio, or discover 910 more undervalued stocks based on cash flows.

Approach 2: CBIZ Price vs Earnings
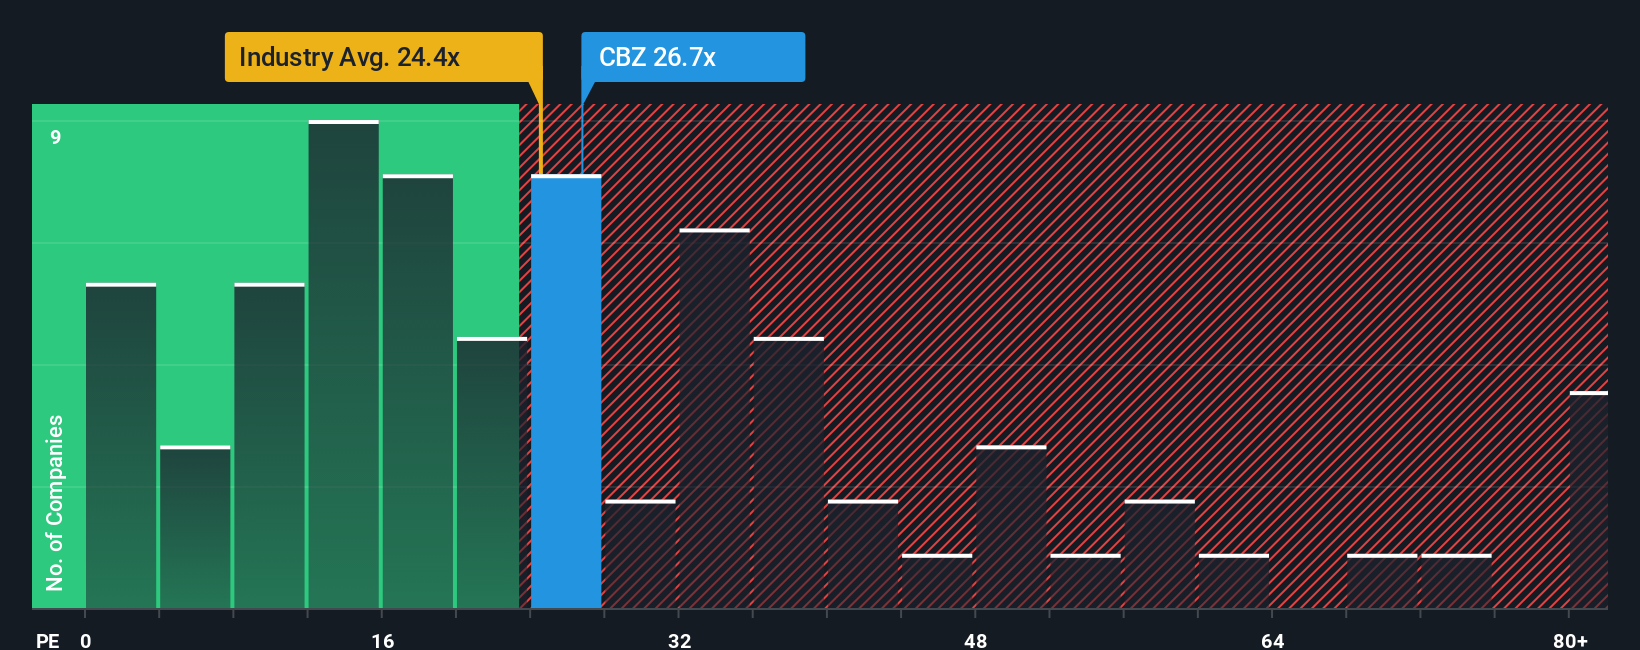
For profitable companies like CBIZ, the price to earnings ratio is a practical way to gauge whether investors are paying a reasonable price for each dollar of current earnings. A higher PE can sometimes be associated with expectations of faster growth or lower risk, while slower growth or higher uncertainty is often associated with a lower, more conservative multiple.
CBIZ currently trades on a PE of about 27.5x, which sits above the broader Professional Services industry average of roughly 24.6x but slightly below the peer group average of around 28.7x. Simply Wall St also calculates a proprietary Fair Ratio of 31.2x, which represents the PE that might be expected for CBIZ after considering its earnings growth outlook, margins, industry positioning, market cap and risk profile. This Fair Ratio is more tailored than a simple comparison with peers or the industry, because it adjusts for the specific characteristics and risks of CBIZ rather than assuming all companies deserve the same multiple.
With CBIZ trading at 27.5x versus a Fair Ratio of 31.2x, the stock appears modestly undervalued on an earnings multiple basis.
Result: UNDERVALUED
PE ratios tell one story, but what if the real opportunity lies elsewhere? Discover 1463 companies where insiders are betting big on explosive growth.
Upgrade Your Decision Making: Choose your CBIZ Narrative
Earlier we mentioned that there is an even better way to understand valuation, so let's introduce you to Narratives, which are simply your story about CBIZ, tied directly to your own assumptions about its future revenue, earnings, margins and what you think is a fair value per share.
A Narrative links three things together in one place: the company story you believe, the financial forecast that follows from that story, and the fair value that drops out of those numbers, so you can see whether the current market price makes sense for you.
On Simply Wall St, Narratives sit inside the Community page, where millions of investors use them as an easy, visual tool to compare their Fair Value to today’s Price, quickly spot whether CBIZ looks like a buy, hold or sell, and then watch that view update automatically when new earnings, news, or guidance arrives.
For CBIZ, one investor might build a bullish Narrative around resilient advisory demand, successful Marcum integration and sustained share repurchases to support a higher fair value near 91.50 dollars per share. In contrast, a more cautious investor could emphasize pricing pressure, acquisition risk and rising competition to justify a much lower fair value and a more conservative stance.
Do you think there's more to the story for CBIZ? Head over to our Community to see what others are saying!

This article by Simply Wall St is general in nature. We provide commentary based on historical data and analyst forecasts only using an unbiased methodology and our articles are not intended to be financial advice. It does not constitute a recommendation to buy or sell any stock, and does not take account of your objectives, or your financial situation. We aim to bring you long-term focused analysis driven by fundamental data. Note that our analysis may not factor in the latest price-sensitive company announcements or qualitative material. Simply Wall St has no position in any stocks mentioned.
Have feedback on this article? Concerned about the content? Get in touch with us directly. Alternatively, email editorial-team@simplywallst.com