
- LIVE QUOTES
- LEARN
- HELP
 Nasdaq
 Wall Street Journal
EN
Hoshino Resorts REIT (TSE:3287) Revenue Growth Reinforces Bullish Community Narrative
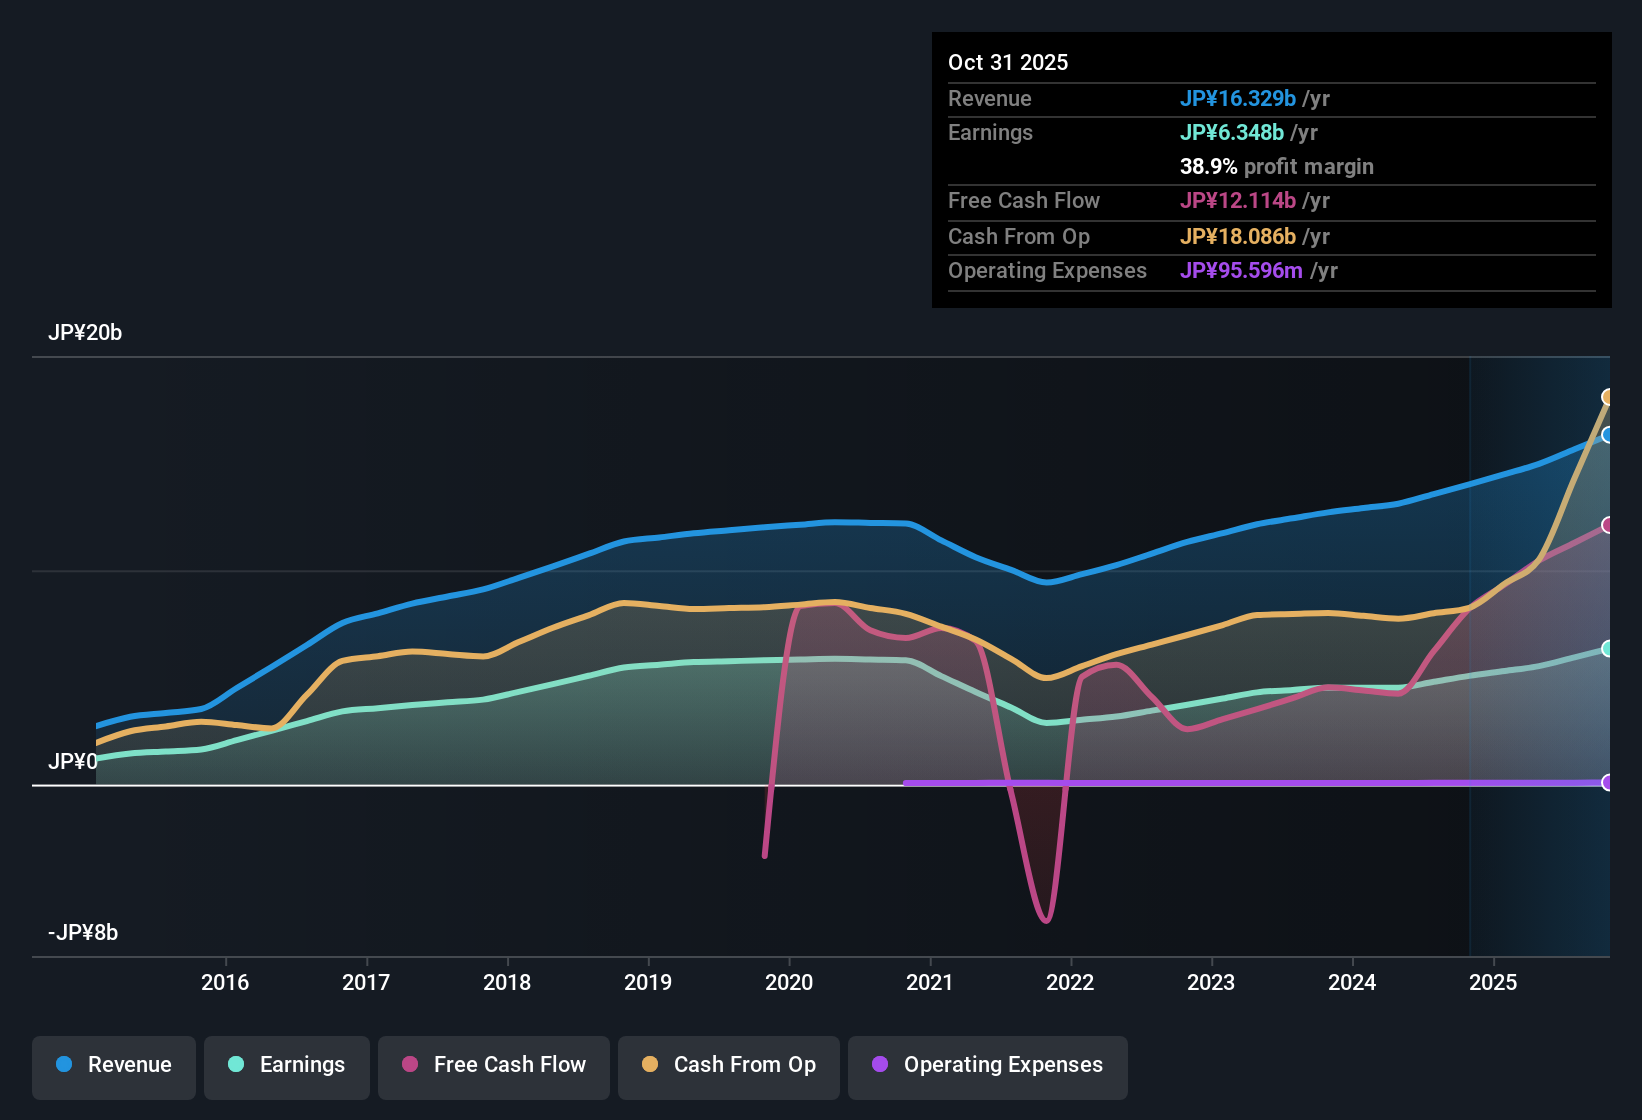
Hoshino Resorts REIT (TSE:3287) has just posted its FY 2025 second half numbers, with total revenue of ¥8.7 billion and basic EPS of ¥6,068.27, setting the tone for another data heavy reporting season. The REIT has seen revenue climb from ¥7.3 billion in the second half of FY 2024 to ¥7.6 billion in the first half of FY 2025 and then to ¥8.7 billion in the latest period. Trailing 12 month EPS has moved from ¥9,376.31 to ¥9,556.35 and now ¥10,836.31, giving investors a clear picture of how the top line and per unit performance have been tracking. With trailing 12 month net profit margins at 38.9% versus 36.2% a year earlier and one year earnings growth of 25.1% outpacing the five year 7.8% trend, this update presents a picture of a REIT that is steadily tightening its profitability profile.
See our full analysis for Hoshino Resorts REIT.With the headline figures on the table, the next step is to see how these results line up with the dominant narratives around Hoshino Resorts REIT, from growth momentum to payout sustainability, and where the latest numbers might start to shift that story.
Curious how numbers become stories that shape markets? Explore Community Narratives
FFO and profit trends support growth story
- Over the last 12 months, funds from operations were ¥4,852 million and net income reached ¥6,348 million on revenue of about ¥16.3 billion, alongside a 7.8% per year profit growth rate over five years and a 25.1% one year earnings rise.
- What is striking for the bullish view is how multi year profit growth and the latest 25.1% earnings increase line up with these cash and profit figures, suggesting that the REIT has been able to turn rising revenue into higher profits while:
- Net profit margin moved to 38.9% over the last year compared with 36.2% a year earlier, indicating more of each yen of revenue has been dropping to the bottom line.
- Trailing 12 month EPS climbed from ¥9,376.31 to ¥10,836.31, which fits the story of steady expansion rather than one off strength.
Income and balance sheet pressures for a 3.74 percent yield
- The REIT is offering a 3.74% dividend yield, yet that payout was not well covered by earnings and debt was described as not being well covered by operating cash flow over the last 12 months.
- Critics of the name focus on this more cautious side of the story, arguing that balance sheet pressure and payout coverage limits could matter just as much as recent profit growth because:
- Weak debt coverage by operating cash flow means that if cash generation softens from recent levels, the REIT may have less room to manage both interest costs and distributions comfortably.
- Dividends not being well covered by earnings at the same time as profits rose 25.1% over the last year raises the question of how resilient those distributions would be if earnings growth settles back toward the 7.8% five year pace.
Premium P E but discount to DCF fair value
- The units trade on a trailing P E of 22.8 times, above peer and industry averages of 16.5 times and 15.4 times, while at the same time sitting about 25.3% below an estimated DCF fair value of ¥330,588.72 versus a current share price of ¥246,900.
- What stands out here for valuation focused investors is the tension between a higher than peer multiple and the implied upside from the DCF fair value, because:
- The richer P E multiple suggests the market is already paying up relative to other hotel and resort REITs even though it is not paying as much as the discounted cash flow approach implies.
- The combination of a 38.9% net margin and 25.1% one year earnings growth helps explain why a premium multiple might be justifiable on fundamentals, while the gap to DCF fair value frames how much further upside that model still sees.
Next Steps
Don't just look at this quarter; the real story is in the long-term trend. We've done an in-depth analysis on Hoshino Resorts REIT's growth and its valuation to see if today's price is a bargain. Add the company to your watchlist or portfolio now so you don't miss the next big move.
See What Else Is Out There
Hoshino Resorts REIT’s appeal is tempered by weak dividend cover and stretched debt metrics, raising questions about how resilient its distributions would be under pressure.
If you want income ideas with sturdier foundations, use our solid balance sheet and fundamentals stocks screener (1941 results) today to quickly focus on businesses built with stronger coverage, lower leverage and more durable payouts.
This article by Simply Wall St is general in nature. We provide commentary based on historical data and analyst forecasts only using an unbiased methodology and our articles are not intended to be financial advice. It does not constitute a recommendation to buy or sell any stock, and does not take account of your objectives, or your financial situation. We aim to bring you long-term focused analysis driven by fundamental data. Note that our analysis may not factor in the latest price-sensitive company announcements or qualitative material. Simply Wall St has no position in any stocks mentioned.
Have feedback on this article? Concerned about the content? Get in touch with us directly. Alternatively, email editorial-team@simplywallst.com