
- LIVE QUOTES
- LEARN
- HELP
 Nasdaq
 Wall Street Journal
EN
Is monday.com Starting To Look Attractive After Its 35% 2025 Share Price Slide?
- Wondering if monday.com is starting to look like a bargain after its slide, or if the market is signaling deeper concerns about the business.
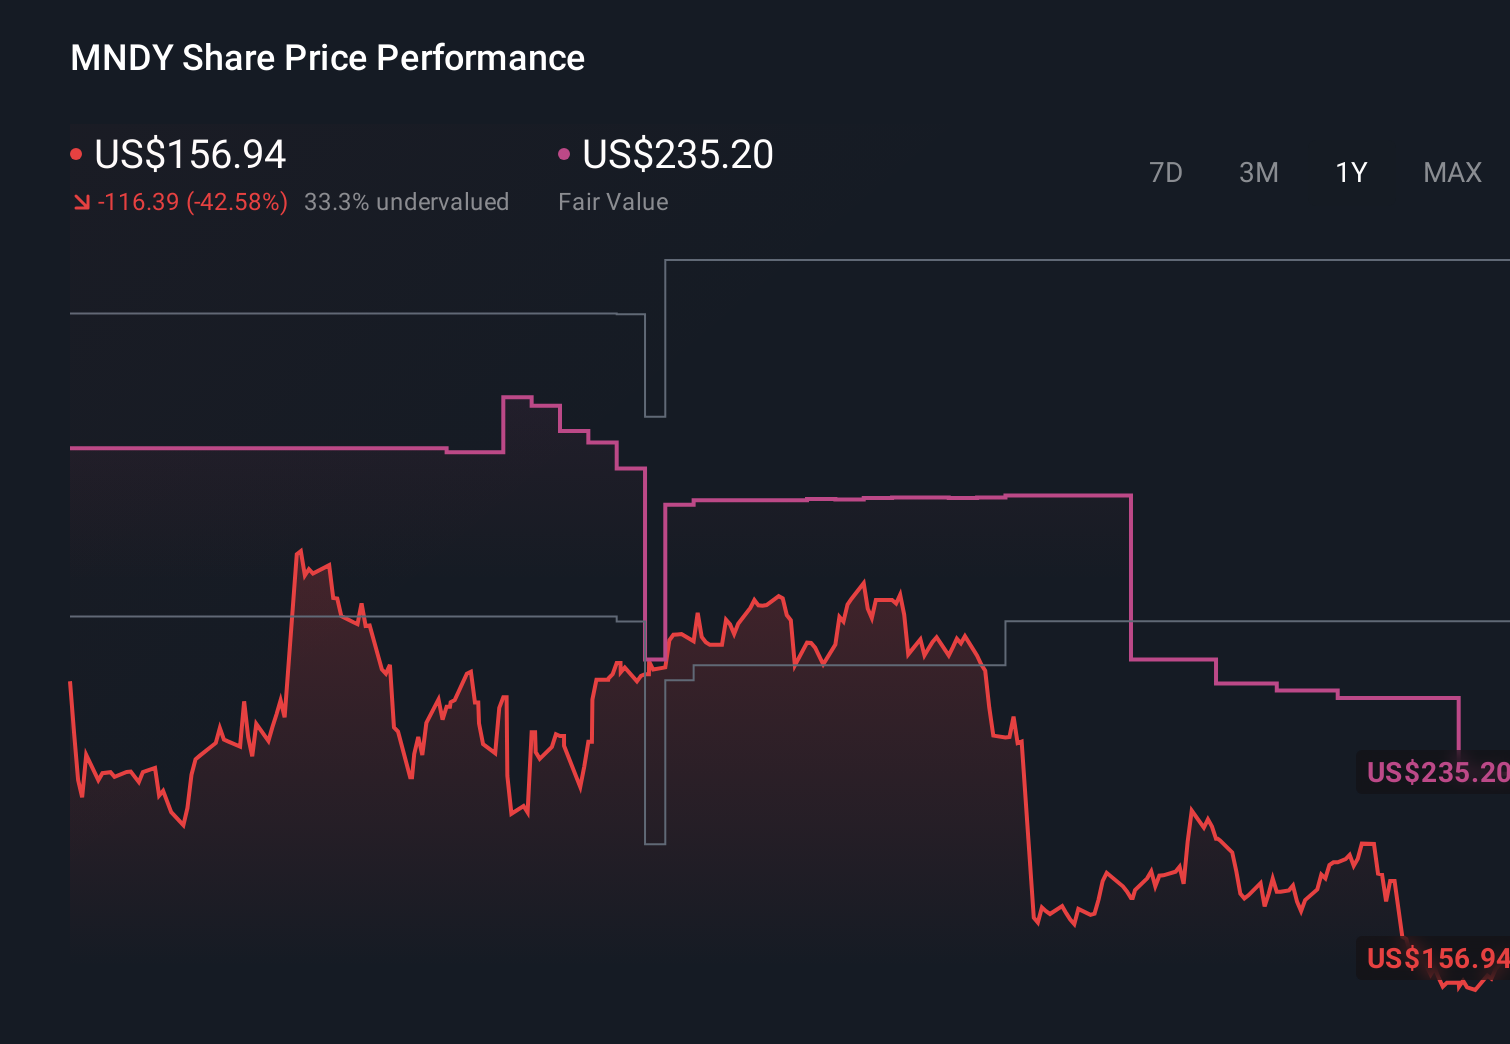
- The stock is down 7.6% over the last week, 6.5% over the past month, and a steep 35.0% year to date, extending a 40.4% drop over the last year despite still being up 29.5% over three years.
- Much of this volatility has been driven by shifting sentiment toward high growth software names as interest rate expectations change, with investors rotating in and out of the sector as risk appetite swings. At the same time, monday.com continues to roll out new platform capabilities and integrations that aim to deepen customer adoption and defend its competitive position.
- On our checks, monday.com scores a 3/6 valuation score, suggesting it looks undervalued on some metrics but not across the board. In the next sections we will unpack those different valuation lenses, before finishing with a broader way to think about what the market might really be pricing in.
Find out why monday.com's -40.4% return over the last year is lagging behind its peers.
Approach 1: monday.com Discounted Cash Flow (DCF) Analysis
A Discounted Cash Flow model estimates what a company is worth by projecting the cash it can generate in the future and then discounting those cash flows back to today in dollar terms. For monday.com, the 2 Stage Free Cash Flow to Equity model starts with last twelve month free cash flow of about $331.0 million, and then applies analyst forecasts for the next few years before extrapolating longer term growth.
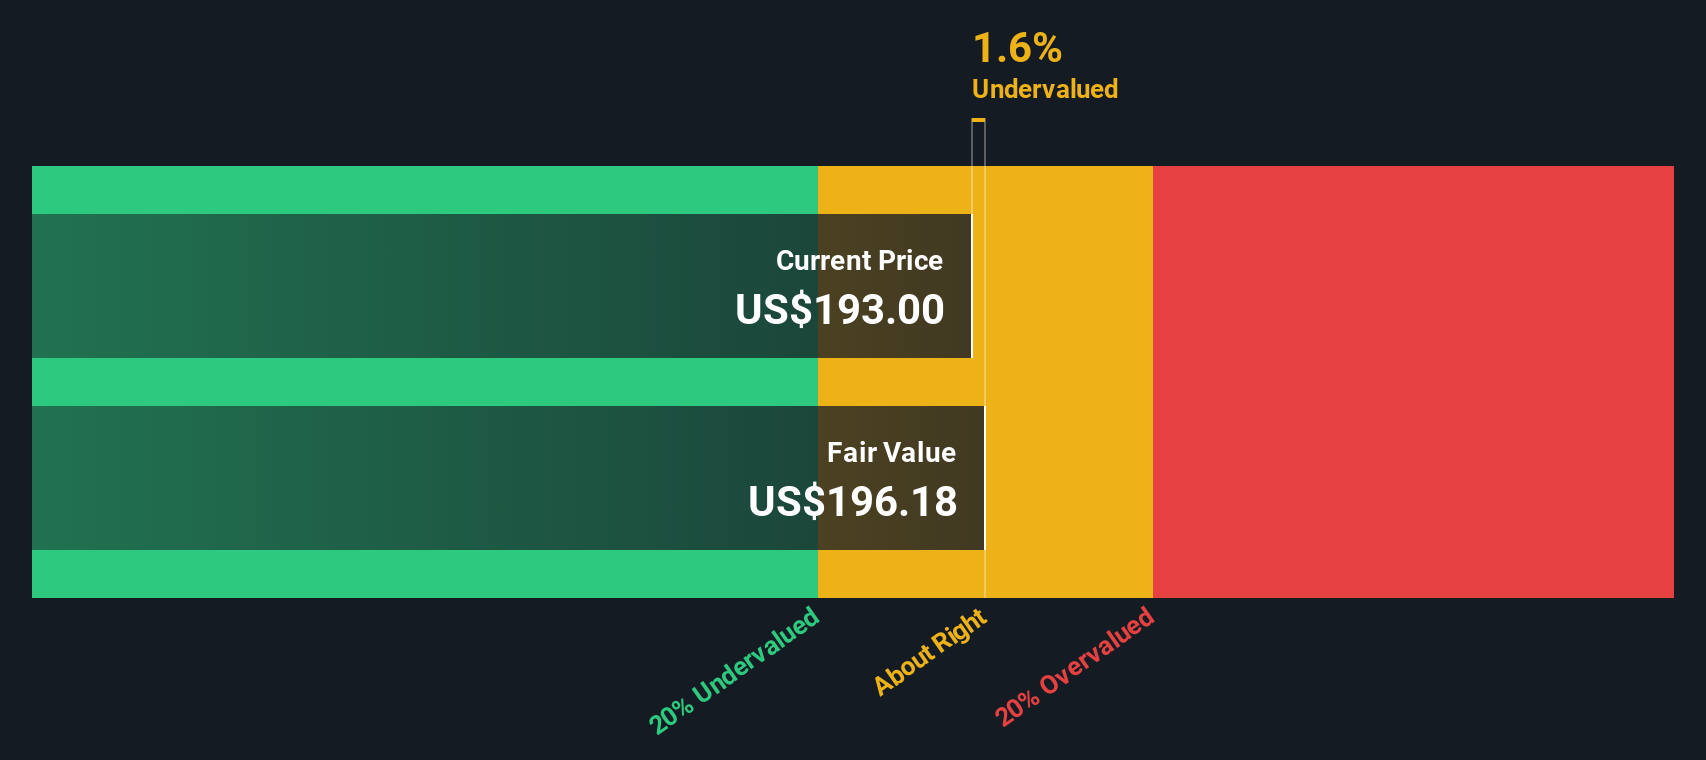
Analysts see free cash flow rising into the mid hundreds of millions of dollars over the next decade, with Simply Wall St projections pointing to around $1.1 billion of free cash flow by 2035. When all those future cash flows are discounted back to today, the model arrives at an intrinsic value of roughly $189.62 per share.
Compared to the current share price, this implies a 20.8% discount. This indicates the market is pricing in a more cautious outlook than the cash flow projections assume.
Result: UNDERVALUED
Our Discounted Cash Flow (DCF) analysis suggests monday.com is undervalued by 20.8%. Track this in your watchlist or portfolio, or discover 915 more undervalued stocks based on cash flows.
Approach 2: monday.com Price vs Earnings
For a profitable company like monday.com, the price to earnings ratio is a useful way to gauge how much investors are willing to pay for each dollar of current profits. Higher growth and lower perceived risk usually justify a higher PE, while slower growth or greater uncertainty typically call for a lower, more conservative multiple.
monday.com currently trades on a rich 119.0x PE, well above the broader Software industry average of about 32.7x and also ahead of its high growth peer group at around 39.0x. On those simple comparisons alone, the stock screens as expensive. To go a level deeper, Simply Wall St calculates a proprietary Fair Ratio of 43.1x, which reflects what a reasonable PE might be once you factor in monday.com's earnings growth outlook, profit margins, industry dynamics, market cap and specific risk profile.
This Fair Ratio framework is more tailored than blunt peer or industry comparisons, because it explicitly bakes in how fast the company is expected to grow and how risky those cash flows are. Set against that 43.1x Fair Ratio, the current 119.0x PE suggests the market is paying a substantial premium to what fundamentals alone would support.
Result: OVERVALUED

PE ratios tell one story, but what if the real opportunity lies elsewhere? Discover 1461 companies where insiders are betting big on explosive growth.
Upgrade Your Decision Making: Choose your monday.com Narrative
Earlier we mentioned that there is an even better way to understand valuation, so let's introduce you to Narratives, a simple framework that lets you wrap a clear story around your numbers by linking your assumptions for monday.com's future revenue, earnings and margins to a financial forecast and, ultimately, a fair value estimate.
On Simply Wall St's Community page, millions of investors use Narratives as an easy, accessible tool to set out what they believe will drive a company over time, translate that story into projected financials, and then compare the resulting Fair Value to the current Price to help inform whether it looks like a buy, hold or sell.
Because Narratives update dynamically as fresh information arrives, such as new earnings results or major product announcements, your fair value view can evolve in real time rather than staying frozen in a static model.
For monday.com, for example, one investor might build a bullish Narrative that focuses on strong AI adoption and upmarket expansion to support a fair value closer to $450 per share. A more cautious investor could emphasize competition and execution risks and anchor their Narrative around a fair value nearer $205. Seeing those perspectives side by side can make it easier to decide which story you believe the market is currently underappreciating.
Do you think there's more to the story for monday.com? Head over to our Community to see what others are saying!
This article by Simply Wall St is general in nature. We provide commentary based on historical data and analyst forecasts only using an unbiased methodology and our articles are not intended to be financial advice. It does not constitute a recommendation to buy or sell any stock, and does not take account of your objectives, or your financial situation. We aim to bring you long-term focused analysis driven by fundamental data. Note that our analysis may not factor in the latest price-sensitive company announcements or qualitative material. Simply Wall St has no position in any stocks mentioned.
Have feedback on this article? Concerned about the content? Get in touch with us directly. Alternatively, email editorial-team@simplywallst.com