
- LIVE QUOTES
- LEARN
- HELP
 Nasdaq
 Wall Street Journal
EN
Is Best Buy A Value Opportunity After Recent Share Price Weakness In 2025
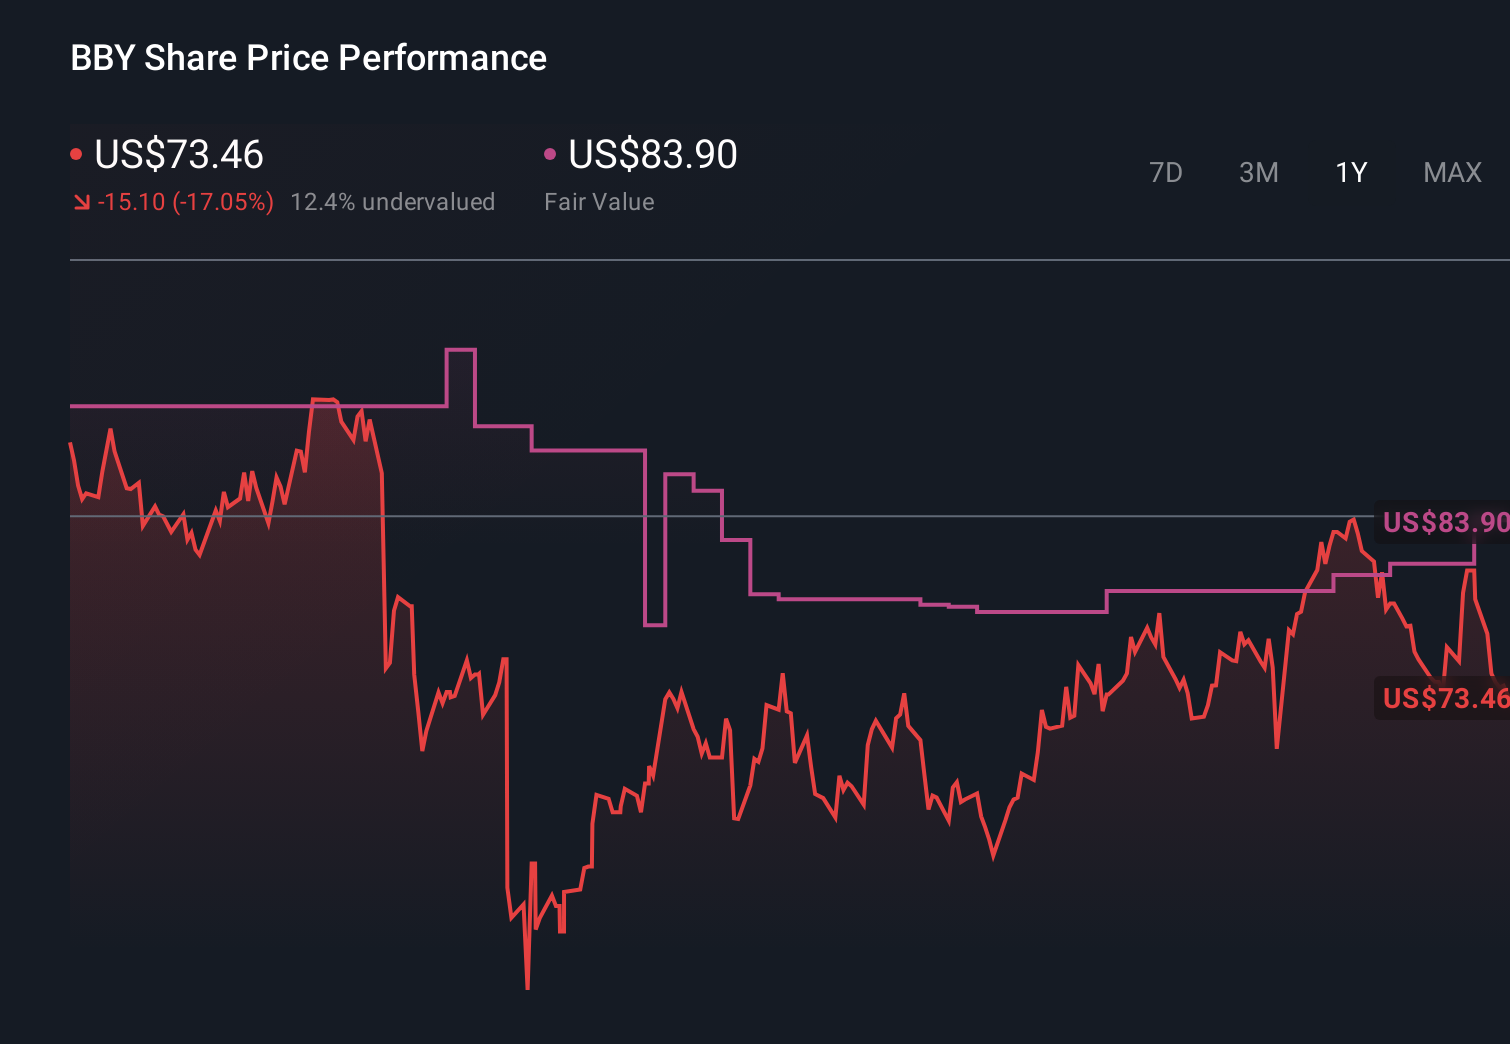
- If you are wondering whether Best Buy at around $72 a share is a bargain or a value trap, this article will walk you through what the numbers are really saying about the stock.
- Despite a modest 5.8% gain over three years, the stock is down 0.8% over the last week, 4.1% over the last month, and 15.7% year to date, which has some investors questioning whether sentiment has swung too far.
- Recent headlines have focused on Best Buy navigating a cooling consumer electronics cycle and leaning into services, memberships, and its omnichannel model, while also returning cash to shareholders through dividends and buybacks. At the same time, the broader retail space has been choppy, which adds another layer of context to Best Buy's recent share price moves.
- In our framework, Best Buy scores a 3/6 valuation score, meaning it screens as undervalued on half of our key checks. We will unpack what that actually means across different valuation methods and then finish with a more nuanced way to think about what the stock is truly worth.
Find out why Best Buy's -12.5% return over the last year is lagging behind its peers.
Approach 1: Best Buy Discounted Cash Flow (DCF) Analysis
A Discounted Cash Flow model takes the cash Best Buy is expected to generate in the future and discounts those projections back into todays dollars to estimate what the entire business is worth.
Best Buy currently generates about $1.48 billion in free cash flow, and analysts expect this to grow steadily over time. By 2030, projected free cash flow is around $2.20 billion, with intermediate years climbing from roughly $1.30 billion in 2026 to nearly $1.91 billion in 2029, before Simply Wall St extrapolates further growth beyond the formal analyst horizon.
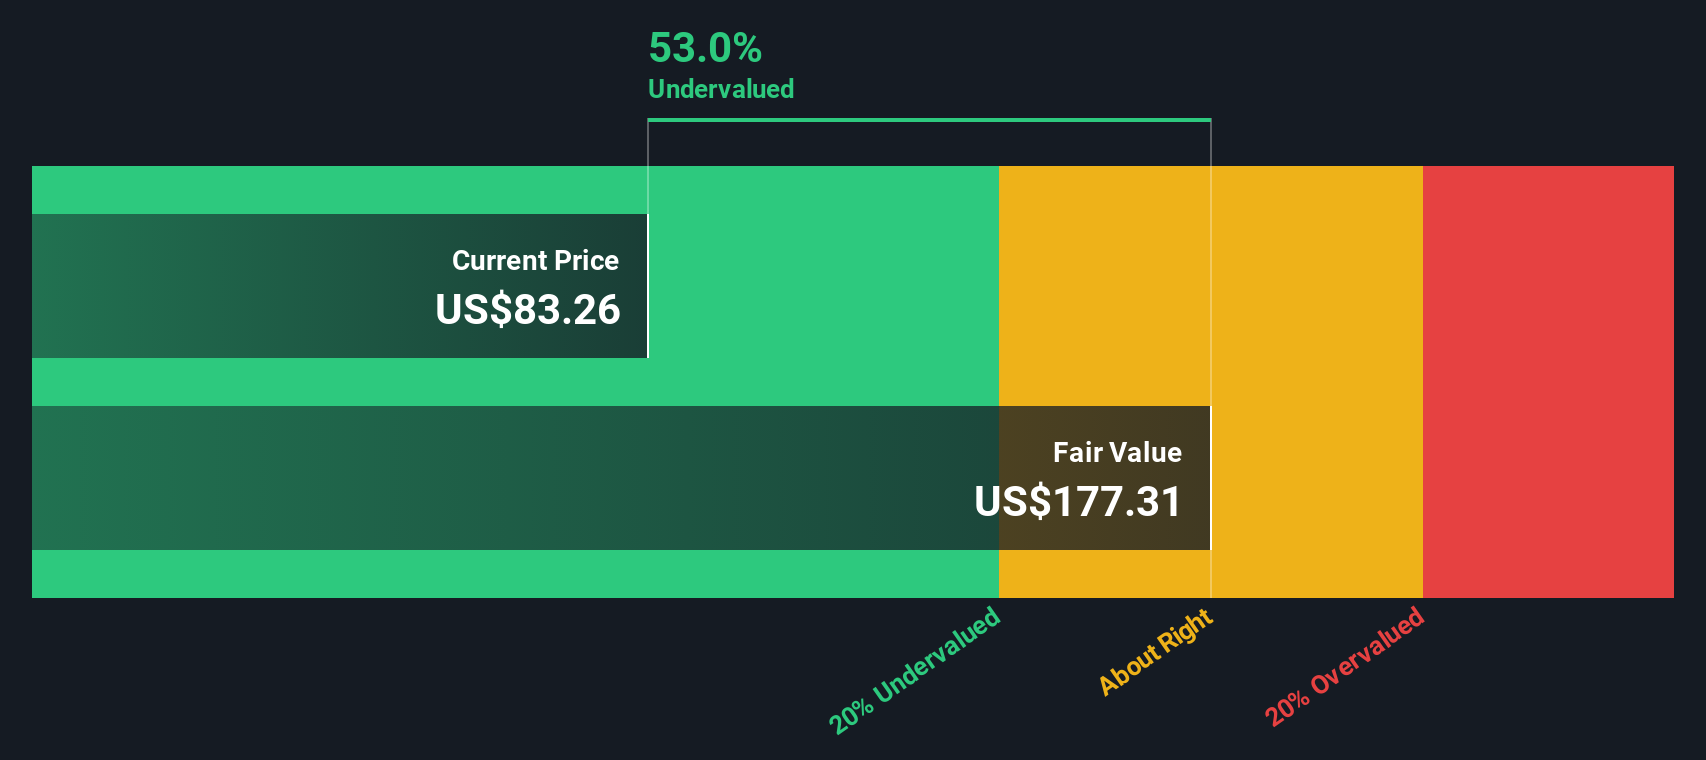
Rolling all of these discounted cash flows together, the DCF model arrives at an intrinsic value of about $167.34 per share. Compared with the recent share price near $72, this implies the stock trades at roughly a 56.6% discount to its modeled fair value. This indicates the market is heavily discounting Best Buys future cash generation.
Result: UNDERVALUED
Our Discounted Cash Flow (DCF) analysis suggests Best Buy is undervalued by 56.6%. Track this in your watchlist or portfolio, or discover 914 more undervalued stocks based on cash flows.
Approach 2: Best Buy Price vs Earnings
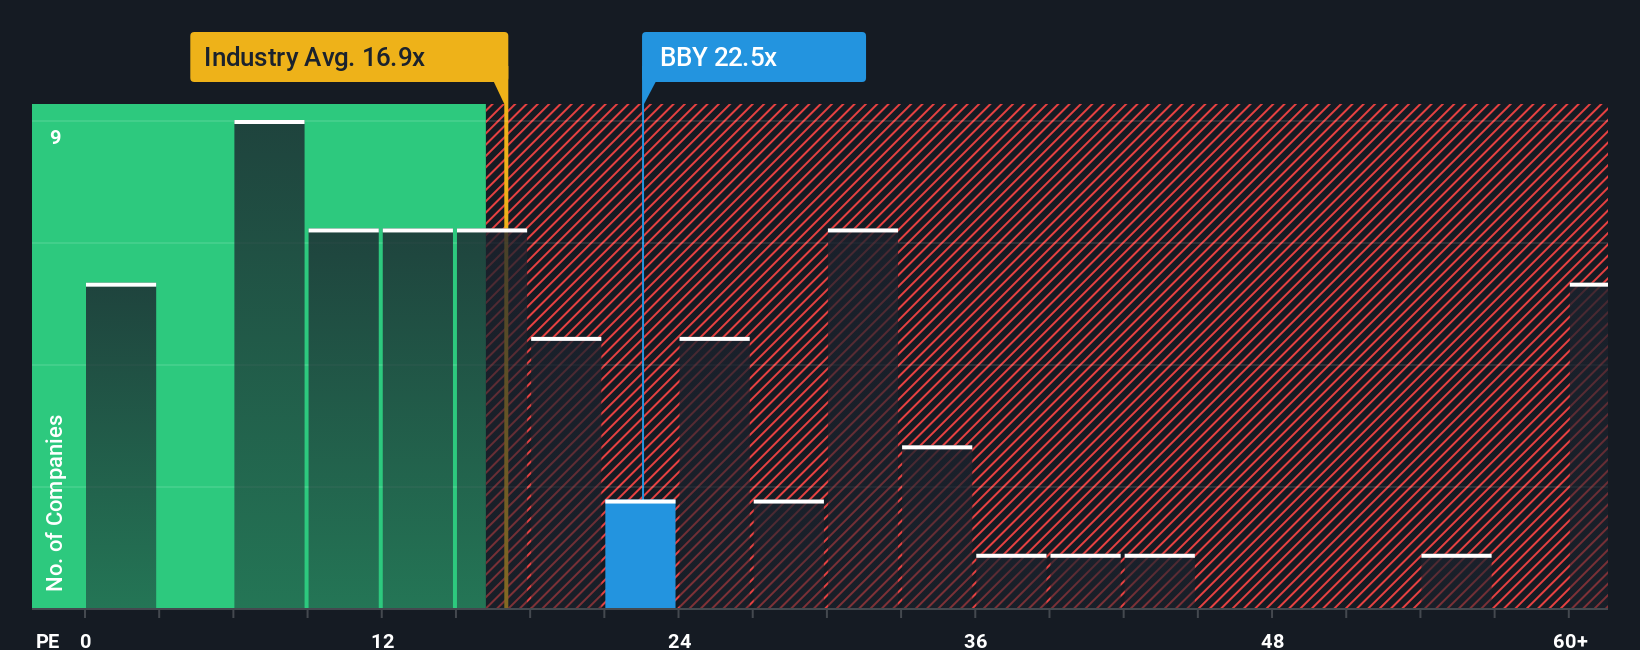
For a mature, consistently profitable retailer like Best Buy, the price to earnings ratio is a practical way to gauge valuation because it links what investors pay for each share directly to the profits the business generates today.
In general, companies with stronger growth prospects and lower perceived risk tend to justify a higher PE multiple, while slower growth or higher uncertainty usually warrant a lower one. Best Buy currently trades at about 23.6x earnings, which is slightly above the Specialty Retail industry average of roughly 20.6x, but below the broader peer group average near 34.8x. Simply Wall St’s Fair Ratio for Best Buy is around 23.1x, which reflects what the PE should be after adjusting for the company’s specific earnings growth outlook, margins, industry, size, and risk profile.
This Fair Ratio is more informative than a simple comparison with industry or peers because it tailors the multiple to Best Buy’s fundamentals rather than assuming all retailers deserve the same valuation. With the actual PE only modestly above the Fair Ratio, the stock screens as slightly expensive on this metric, suggesting mild overvaluation rather than a glaring mispricing.
Result: OVERVALUED
PE ratios tell one story, but what if the real opportunity lies elsewhere? Discover 1461 companies where insiders are betting big on explosive growth.
Upgrade Your Decision Making: Choose your Best Buy Narrative
Earlier we mentioned that there is an even better way to understand valuation, so let us introduce you to Narratives, a simple way to attach your story about a company to the numbers by linking your assumptions about future revenue, earnings and margins to a financial forecast, a fair value, and ultimately a clear buy or sell view. On Simply Wall St, Narratives are easy to use within the Community page, where millions of investors publish their perspectives as structured forecasts that automatically compare Fair Value to the current Price and update dynamically when new information such as earnings results or news hits the market. For Best Buy, one investor might build a bullish Narrative that assumes upgrade cycles, new services and alternative profit streams support higher margins and justify a fair value closer to the high analyst targets around $95. Another might create a more cautious Narrative that leans toward the lower target near $60 because they see tougher competition and cost pressures, and Narratives helps you see exactly how those different stories translate into different fair values and decisions.
Do you think there's more to the story for Best Buy? Head over to our Community to see what others are saying!
This article by Simply Wall St is general in nature. We provide commentary based on historical data and analyst forecasts only using an unbiased methodology and our articles are not intended to be financial advice. It does not constitute a recommendation to buy or sell any stock, and does not take account of your objectives, or your financial situation. We aim to bring you long-term focused analysis driven by fundamental data. Note that our analysis may not factor in the latest price-sensitive company announcements or qualitative material. Simply Wall St has no position in any stocks mentioned.
Have feedback on this article? Concerned about the content? Get in touch with us directly. Alternatively, email editorial-team@simplywallst.com